Note
Go to the end to download the full example code.
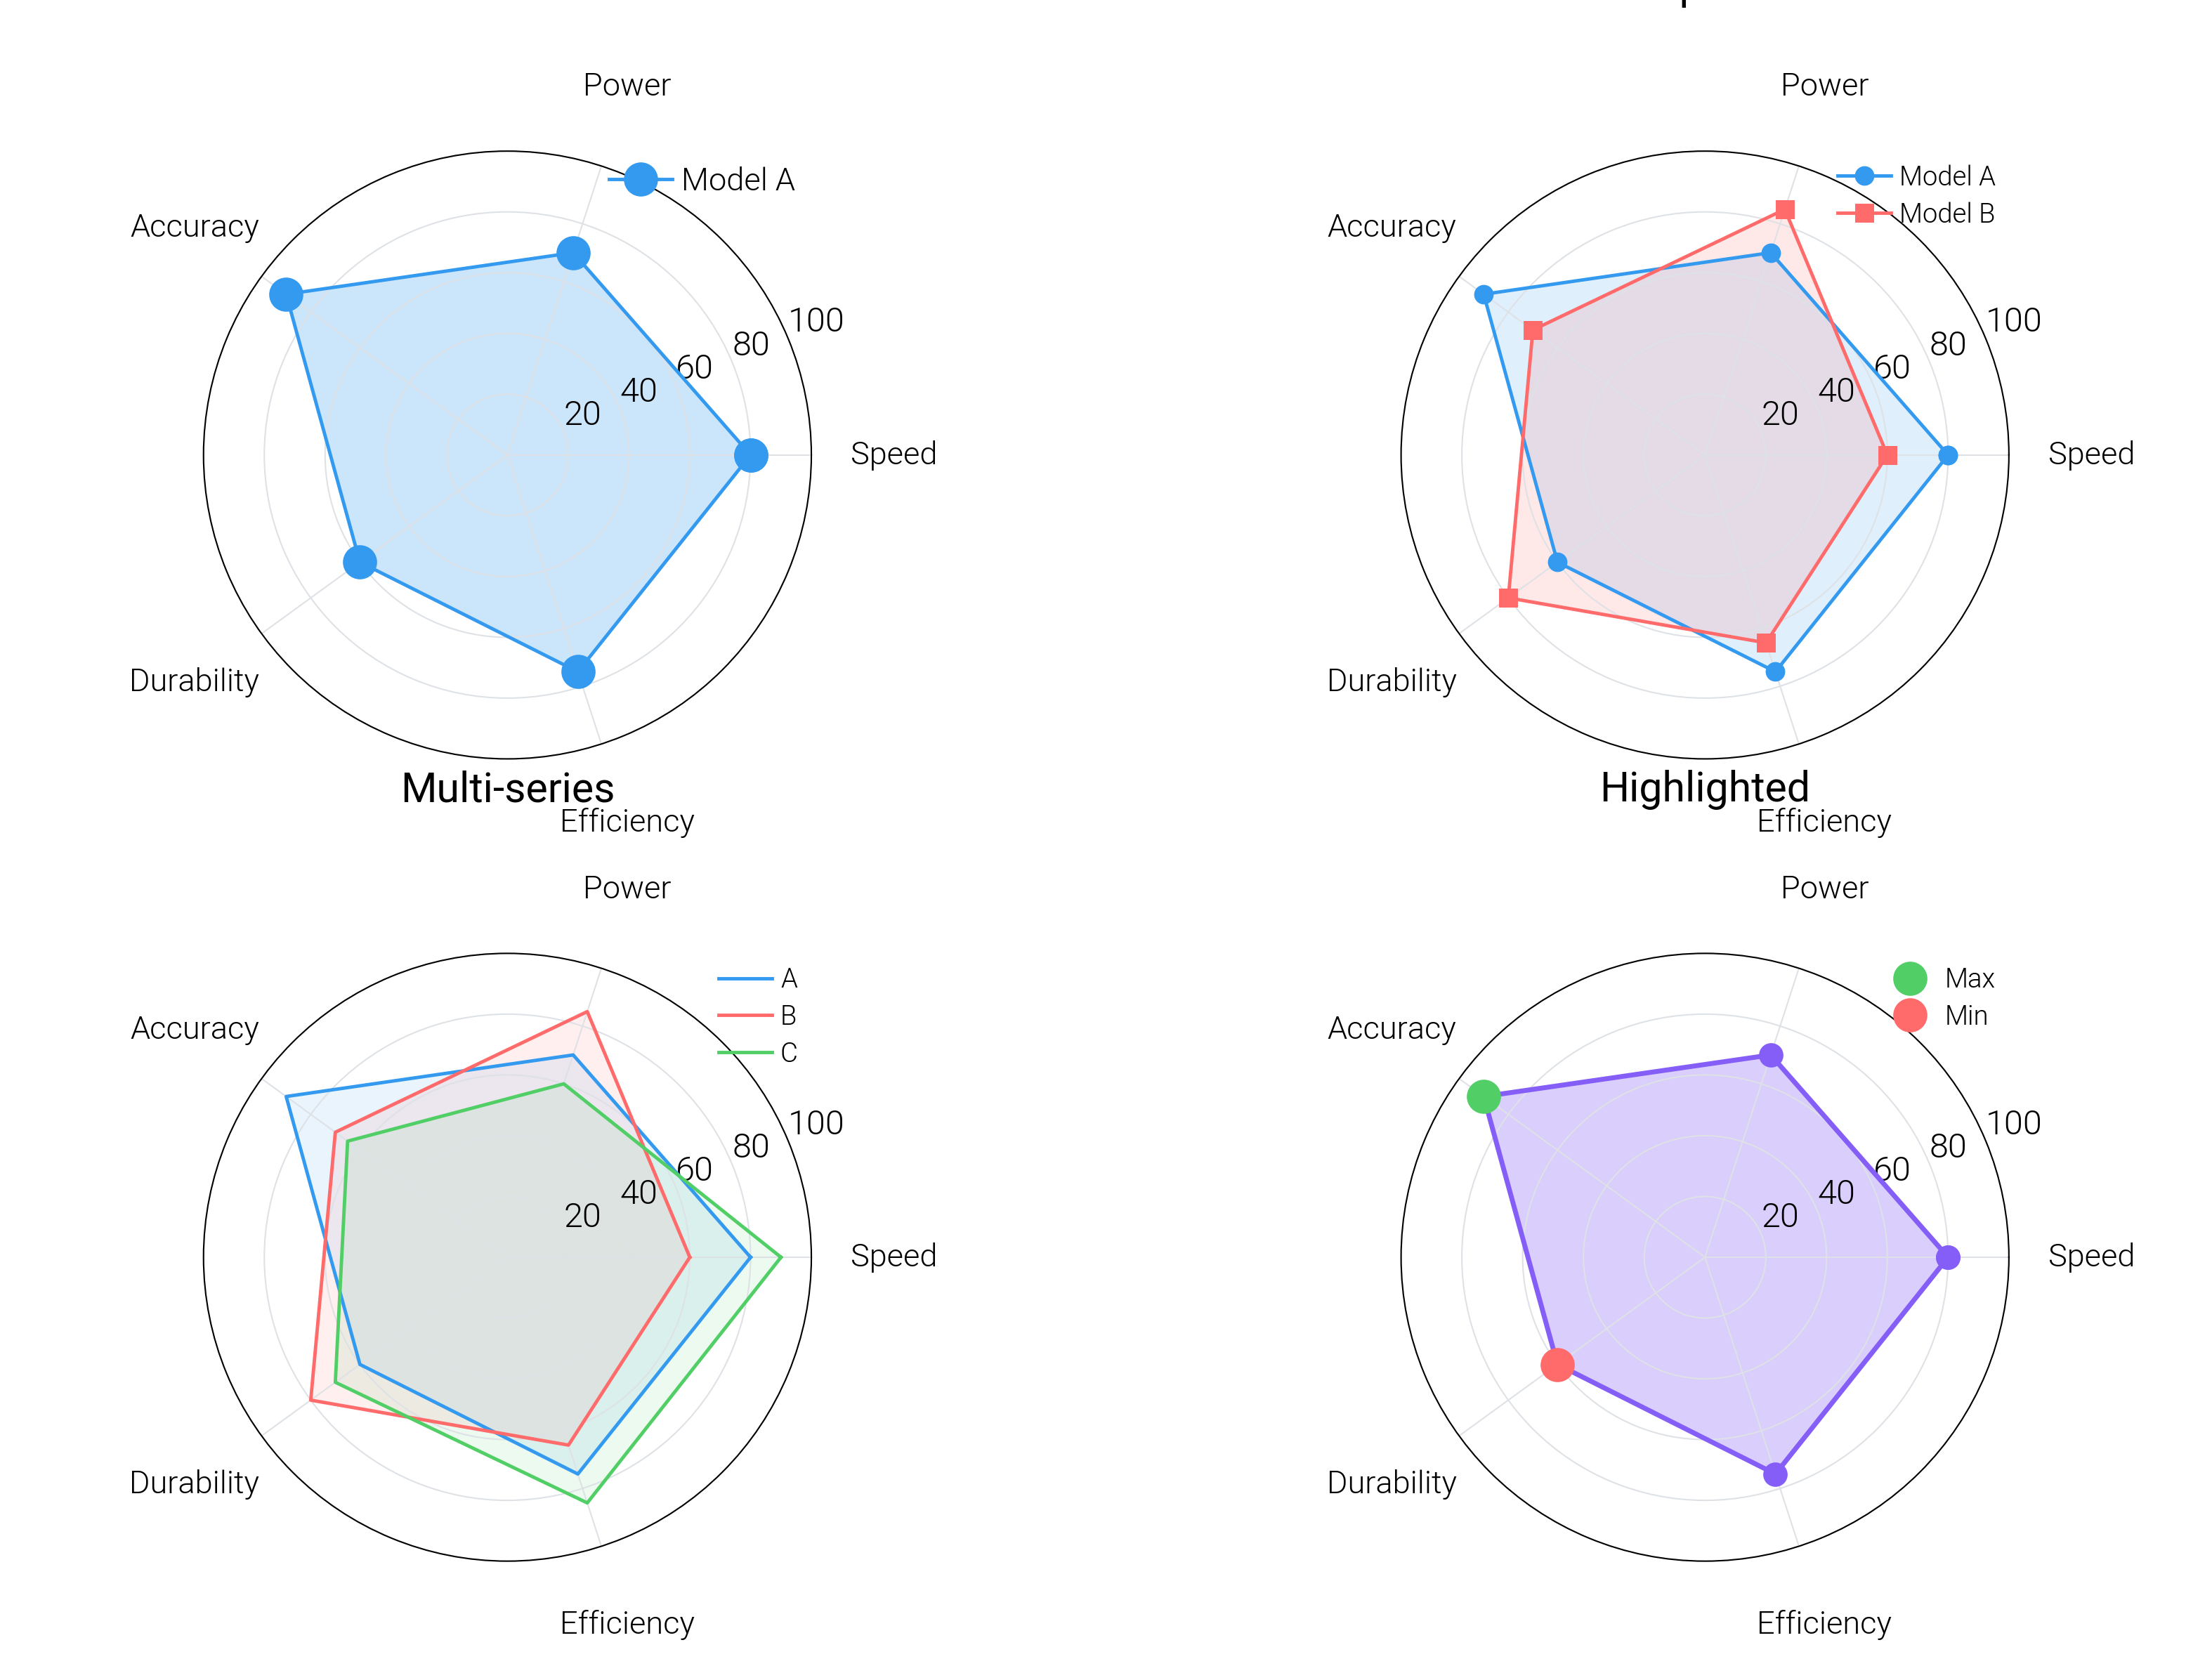
Radar Charts
Design radar/spider charts with normalization, group fills, and label offsets that avoid overlaps.
import matplotlib.pyplot as plt
import numpy as np

import dartwork_mpl as dm

dm.style.use("scientific")

# Data
categories = ["Speed", "Power", "Accuracy", "Durability", "Efficiency"]
n_cats = len(categories)

# Values for different items
values1 = [80, 70, 90, 60, 75]
values2 = [60, 85, 70, 80, 65]
values3 = [90, 60, 65, 70, 85]

# Compute angle for each axis
angles = np.linspace(0, 2 * np.pi, n_cats, endpoint=False).tolist()
values1 += values1[:1]
values2 += values2[:1]
values3 += values3[:1]
angles += angles[:1]
theta_labels_deg = np.degrees(angles[:-1])


def apply_theta_labels(ax, frac=1.05):
    """Place category labels at a consistent distance from the rim."""
    ax.set_thetagrids(theta_labels_deg, labels=categories)
    ax.tick_params(axis="x", labelsize=dm.fs(-1), pad=8)


fig = plt.figure(figsize=(dm.cm2in(16), dm.cm2in(12)), dpi=300)
gs = fig.add_gridspec(
    nrows=2,
    ncols=2,
    left=0.06,
    right=0.94,
    top=0.95,
    bottom=0.07,
    wspace=0.18,
    hspace=0.32,
)

# Panel A: Basic radar
ax1 = fig.add_subplot(gs[0, 0], projection="polar")
ax1.plot(angles, values1, "o-", color="oc.blue5", lw=0.7, label="Model A")
ax1.fill(angles, values1, color="oc.blue5", alpha=0.25)
apply_theta_labels(ax1)
ax1.set_ylim(0, 100)
ax1.set_title("Basic Radar Chart", fontsize=dm.fs(1), pad=15)
ax1.legend(loc="best", fontsize=dm.fs(-1))
ax1.grid(True, linewidth=0.3)

# Panel B: Multiple series
ax2 = fig.add_subplot(gs[0, 1], projection="polar")
ax2.plot(angles, values1, "o-", color="oc.blue5", lw=0.7, ms=3, label="Model A")
ax2.fill(angles, values1, color="oc.blue5", alpha=0.15)
ax2.plot(angles, values2, "s-", color="oc.red5", lw=0.7, ms=3, label="Model B")
ax2.fill(angles, values2, color="oc.red5", alpha=0.15)
apply_theta_labels(ax2)
ax2.set_ylim(0, 100)
ax2.set_title("Comparison", fontsize=dm.fs(1), pad=15)
ax2.legend(loc="best", fontsize=dm.fs(-2))
ax2.grid(True, linewidth=0.3)

# Panel C: Three series
ax3 = fig.add_subplot(gs[1, 0], projection="polar")
ax3.plot(angles, values1, color="oc.blue5", lw=0.7, label="A")
ax3.plot(angles, values2, color="oc.red5", lw=0.7, label="B")
ax3.plot(angles, values3, color="oc.green5", lw=0.7, label="C")
ax3.fill(angles, values1, color="oc.blue5", alpha=0.1)
ax3.fill(angles, values2, color="oc.red5", alpha=0.1)
ax3.fill(angles, values3, color="oc.green5", alpha=0.1)
apply_theta_labels(ax3)
ax3.set_ylim(0, 100)
ax3.set_title("Multi-series", fontsize=dm.fs(1), pad=15)
ax3.legend(loc="best", fontsize=dm.fs(-2))
ax3.grid(True, linewidth=0.3)

# Panel D: Highlighted radar
ax4 = fig.add_subplot(gs[1, 1], projection="polar")
ax4.plot(angles, values1, "o-", color="oc.violet5", lw=1.0, ms=4)
ax4.fill(angles, values1, color="oc.violet5", alpha=0.3)
# Highlight max and min
max_idx = values1[:-1].index(max(values1[:-1]))
min_idx = values1[:-1].index(min(values1[:-1]))
ax4.plot(
    angles[max_idx], values1[max_idx], "o", color="oc.green5", ms=6, label="Max"
)
ax4.plot(
    angles[min_idx], values1[min_idx], "o", color="oc.red5", ms=6, label="Min"
)
apply_theta_labels(ax4)
ax4.set_ylim(0, 100)
ax4.set_title("Highlighted", fontsize=dm.fs(1), pad=15)
ax4.legend(loc="best", fontsize=dm.fs(-2))
ax4.grid(True, linewidth=0.3)

dm.simple_layout(fig, gs=gs)
plt.show()
Total running time of the script: (0 minutes 3.416 seconds)