Note
Go to the end to download the full example code.
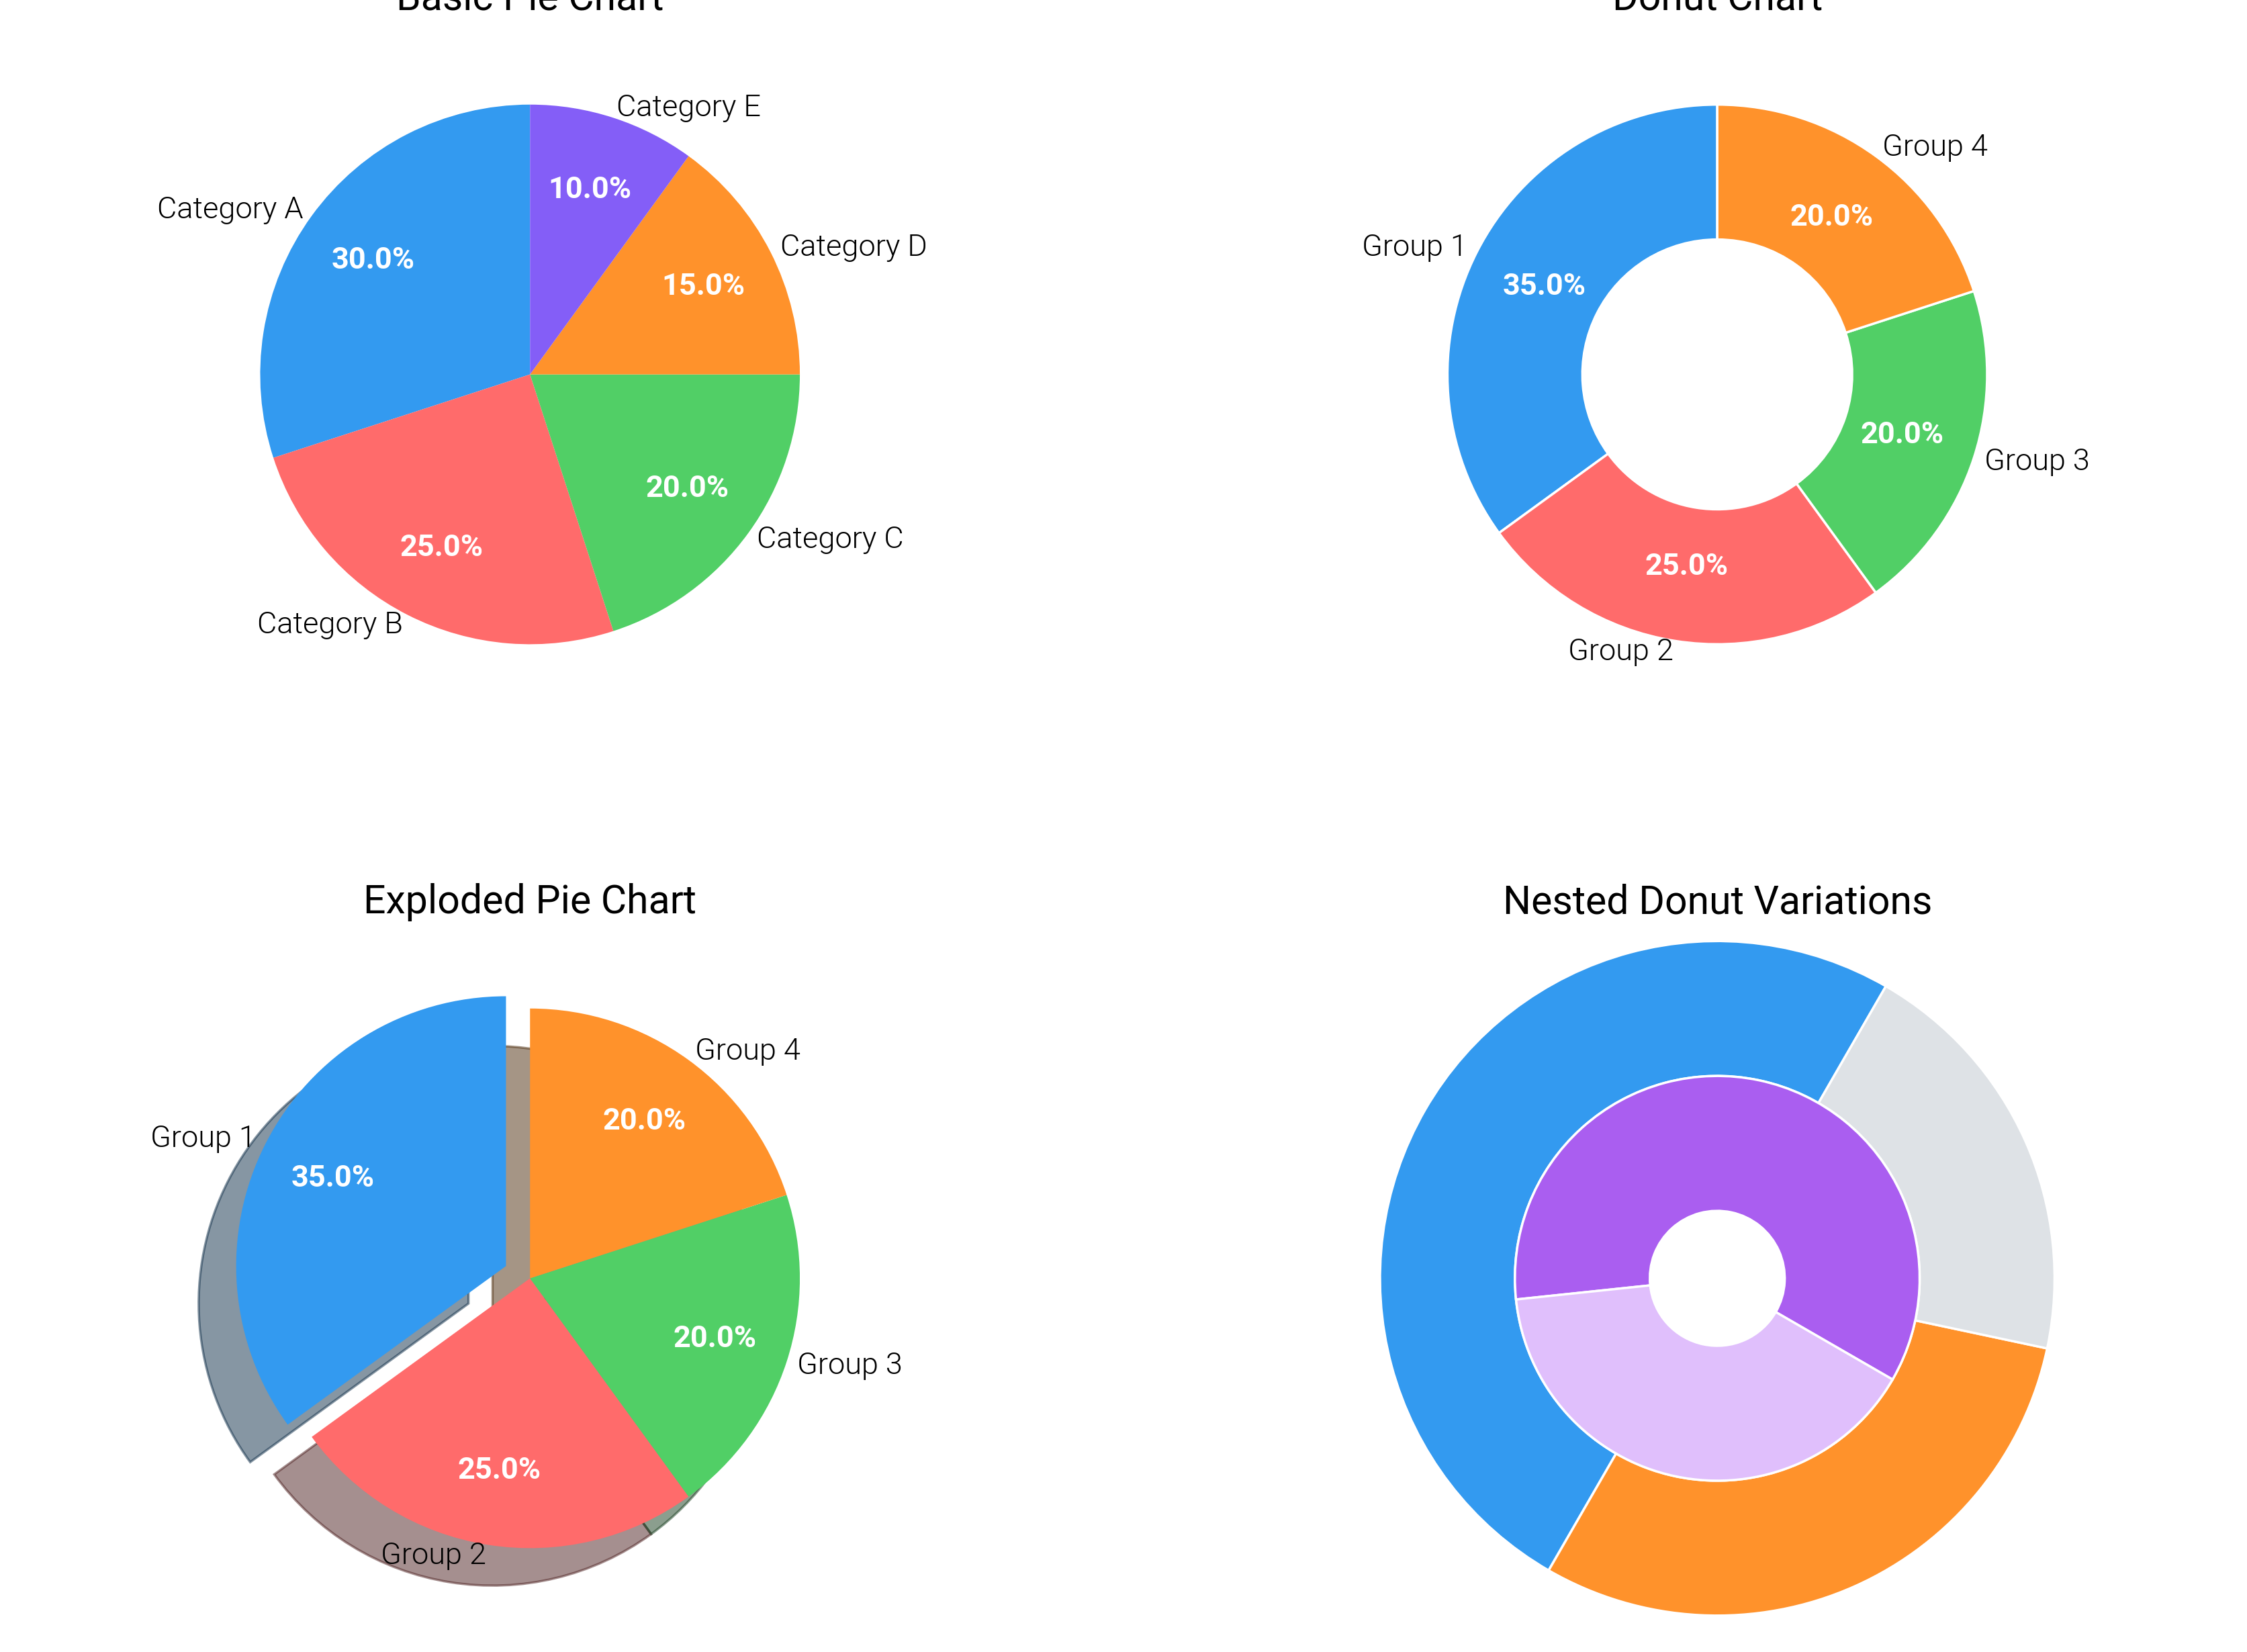
Pie Charts
Build pies, donuts, and nested rings with centered labels and contrast so proportions stay legible.
import matplotlib.colors as mcolors
import matplotlib.pyplot as plt

import dartwork_mpl as dm

# Apply scientific style preset
# Default: font.size=7.5, lines.linewidth=0.5, axes.linewidth=0.3
dm.style.use("scientific")

# Sample data
sizes1 = [30, 25, 20, 15, 10]
labels1 = ["Category A", "Category B", "Category C", "Category D", "Category E"]
# Convert dartwork-mpl color strings to RGB tuples for pie() function
colors1 = [
    mcolors.to_rgb("oc.blue5"),
    mcolors.to_rgb("oc.red5"),
    mcolors.to_rgb("oc.green5"),
    mcolors.to_rgb("oc.orange5"),
    mcolors.to_rgb("oc.violet5"),
]

sizes2 = [35, 25, 20, 20]
labels2 = ["Group 1", "Group 2", "Group 3", "Group 4"]
colors2 = [
    mcolors.to_rgb("oc.blue5"),
    mcolors.to_rgb("oc.red5"),
    mcolors.to_rgb("oc.green5"),
    mcolors.to_rgb("oc.orange5"),
]

# Explode values
explode1 = (0.05, 0, 0, 0, 0)
explode2 = (0.1, 0, 0, 0)

# Create figure
# Square layout for even slices
fig = plt.figure(figsize=(dm.cm2in(17), dm.cm2in(12.5)), dpi=300)

# Create GridSpec for 3 subplots
gs = fig.add_gridspec(
    nrows=2,
    ncols=2,
    left=0.06,
    right=0.96,
    top=0.94,
    bottom=0.10,
    wspace=0.12,
    hspace=0.34,
)

# Panel A: Basic pie chart
ax1 = fig.add_subplot(gs[0, 0])
# Explicit parameters: startangle=90, autopct='%1.1f%%', textprops fontsize
wedges1, texts1, autotexts1 = ax1.pie(
    sizes1,
    labels=labels1,
    colors=colors1,
    autopct="%1.1f%%",
    startangle=90,
    labeldistance=1.04,
    pctdistance=0.72,
    textprops={"fontsize": dm.fs(-1)},
)
# Set autopct text color and size
for autotext in autotexts1:
    autotext.set_color("white")
    autotext.set_fontweight("bold")
    autotext.set_fontsize(dm.fs(-1))
ax1.set_title("Basic Pie Chart", fontsize=dm.fs(1))

# Panel B: Donut chart (pie with hole)
ax2 = fig.add_subplot(gs[0, 1])
# Explicit parameters: startangle=90, autopct='%1.1f%%', wedgeprops for donut
wedges2, texts2, autotexts2 = ax2.pie(
    sizes2,
    labels=labels2,
    colors=colors2,
    autopct="%1.1f%%",
    startangle=90,
    labeldistance=1.04,
    pctdistance=0.72,
    textprops={"fontsize": dm.fs(-1)},
    wedgeprops={"width": 0.5, "edgecolor": "white", "linewidth": 0.5},
)
# Set autopct text color and size
for autotext in autotexts2:
    autotext.set_color("white")
    autotext.set_fontweight("bold")
    autotext.set_fontsize(dm.fs(-1))
ax2.set_title("Donut Chart", fontsize=dm.fs(1))

# Panel C: Exploded pie chart
ax3 = fig.add_subplot(gs[1, 0])
# Explicit parameters: explode, shadow=True, startangle=90
wedges3, texts3, autotexts3 = ax3.pie(
    sizes2,
    labels=labels2,
    colors=colors2,
    explode=explode2,
    shadow=True,
    autopct="%1.1f%%",
    startangle=90,
    labeldistance=1.04,
    pctdistance=0.72,
    textprops={"fontsize": dm.fs(-1)},
)
# Set autopct text color and size
for autotext in autotexts3:
    autotext.set_color("white")
    autotext.set_fontweight("bold")
    autotext.set_fontsize(dm.fs(-1))
ax3.set_title("Exploded Pie Chart", fontsize=dm.fs(1))


# Panel D: Nested donut comparison
ax4 = fig.add_subplot(gs[1, 1])
outer_sizes = [0.5, 0.3, 0.2]
inner_sizes = [0.6, 0.4]
colors_outer = ["oc.blue5", "oc.orange5", "oc.gray3"]
colors_inner = ["oc.purple5", "oc.purple2"]
ax4.pie(
    outer_sizes,
    radius=1.0,
    colors=colors_outer,
    wedgeprops={"width": 0.4, "edgecolor": "white"},
    startangle=60,
)
ax4.pie(
    inner_sizes,
    radius=0.6,
    colors=colors_inner,
    wedgeprops={"width": 0.4, "edgecolor": "white"},
    startangle=-30,
)
ax4.set_title("Nested Donut Variations", fontsize=dm.fs(1))
ax4.axis("equal")

# Keep all pies perfectly circular and visible
for ax in (ax1, ax2, ax3, ax4):
    ax.set_aspect("equal", adjustable="box")

# Optimize layout
dm.simple_layout(fig, gs=gs, margins=(0.08, 0.08, 0.08, 0.12))

# Show plot
plt.show()
Total running time of the script: (0 minutes 1.265 seconds)