Note
Go to the end to download the full example code.
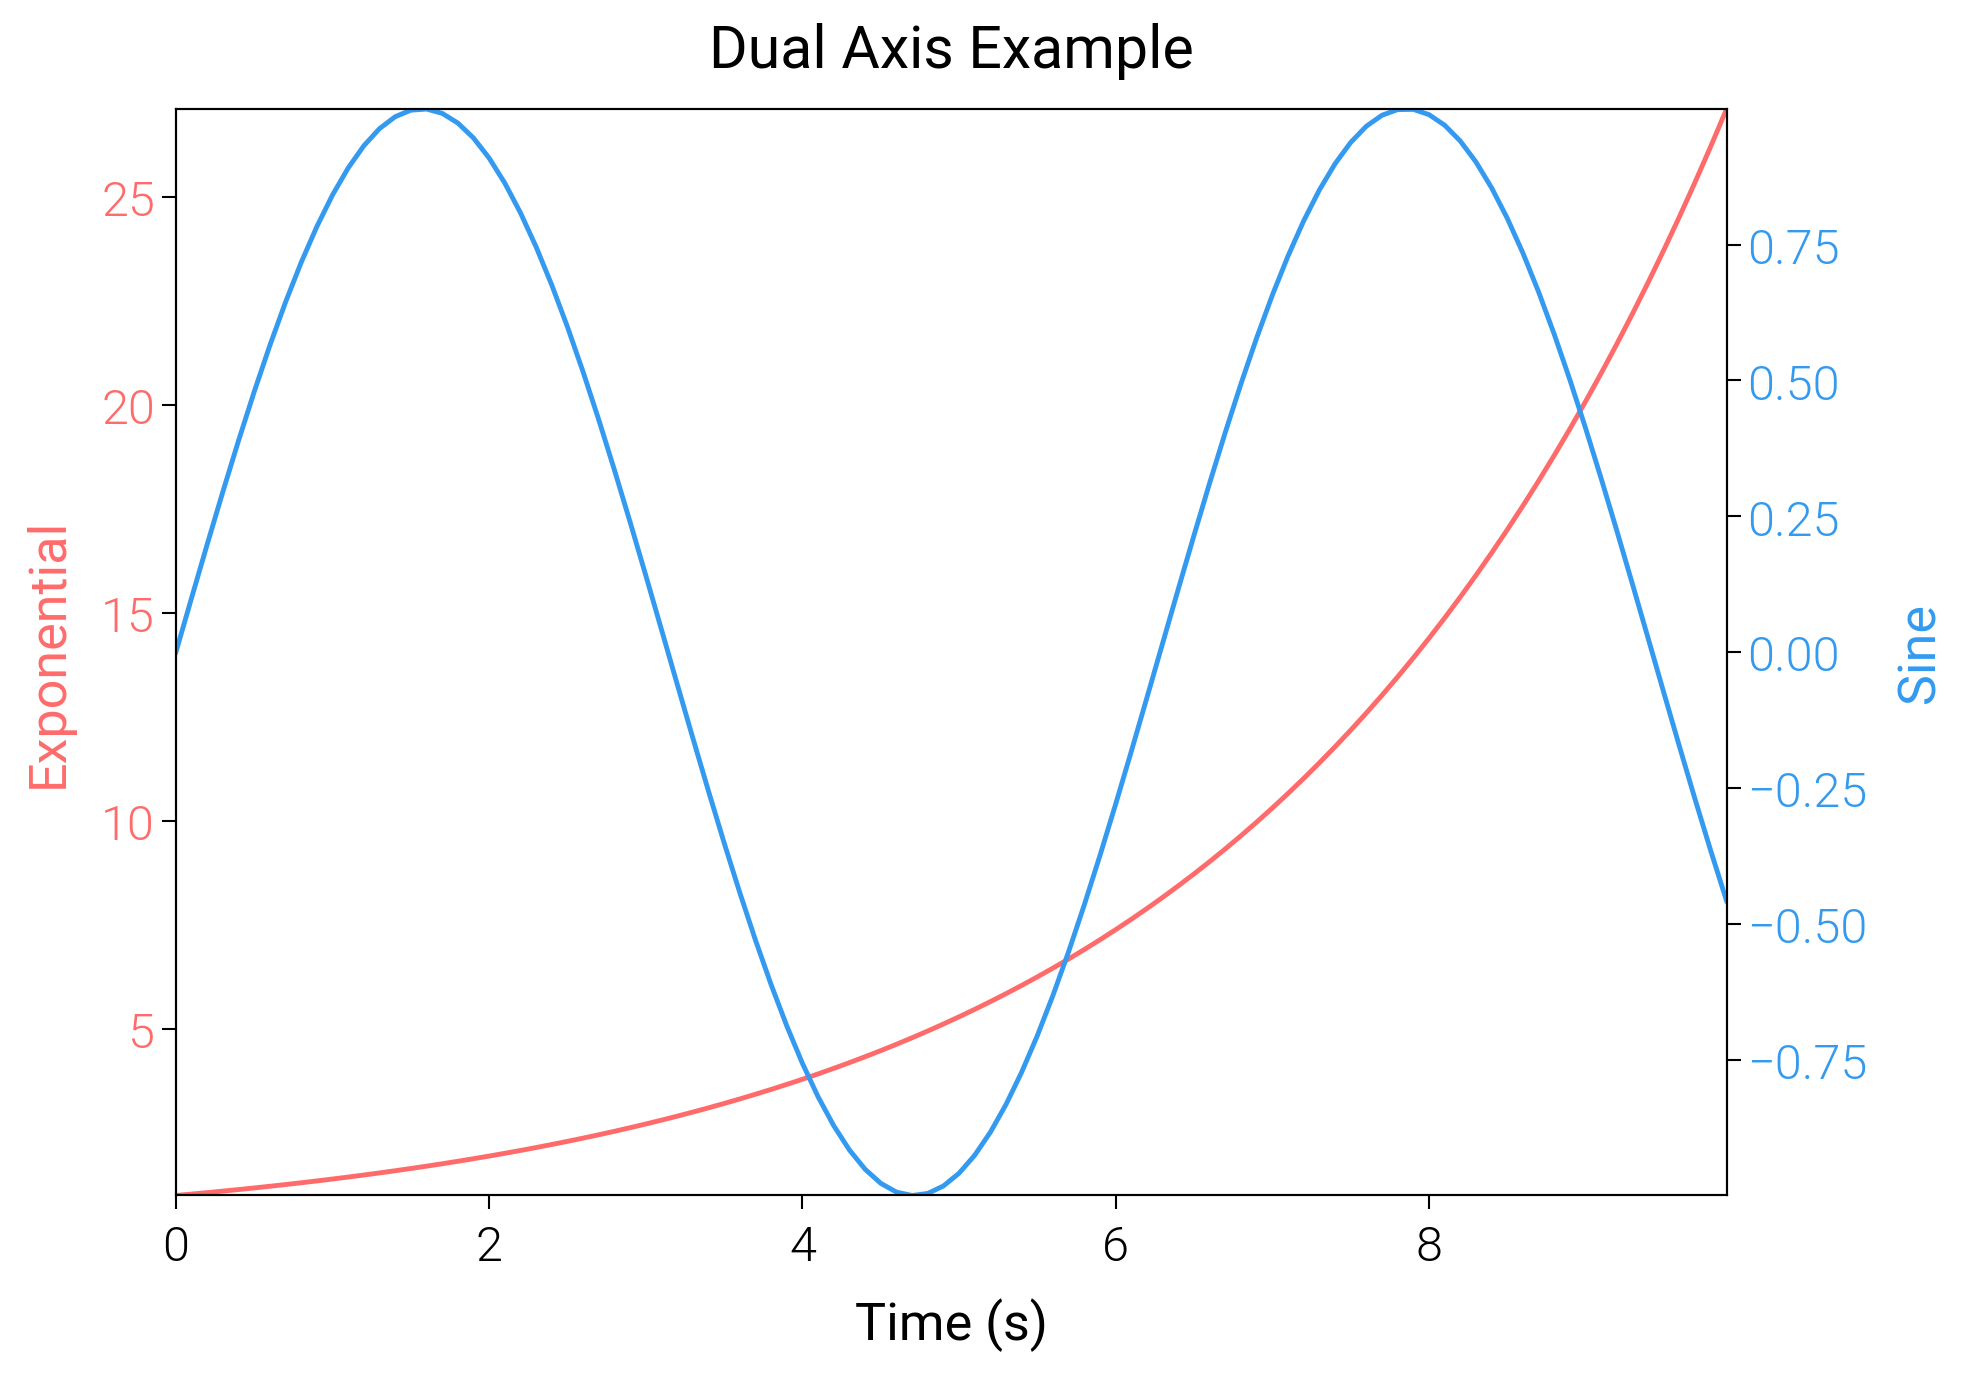
Dual Axis
Align two y-axes with matching grids, offsets, and legends to reduce reader confusion.
import matplotlib.pyplot as plt
import numpy as np

import dartwork_mpl as dm

dm.style.use("scientific")

x = np.arange(0, 10, 0.1)
y1 = np.exp(x / 3)
y2 = np.sin(x)

fig = plt.figure(figsize=(dm.cm2in(10), dm.cm2in(7)), dpi=300)
gs = fig.add_gridspec(1, 1, left=0.15, right=0.85, top=0.92, bottom=0.15)
ax1 = fig.add_subplot(gs[0, 0])

# Plot on primary axis
color1 = "oc.red5"
ax1.set_xlabel("Time (s)", fontsize=dm.fs(0))
ax1.set_ylabel("Exponential", color=color1, fontsize=dm.fs(0))
ax1.plot(x, y1, color=color1, lw=0.7, label="Exp")
ax1.tick_params(axis="y", labelcolor=color1)

# Create secondary axis
ax2 = ax1.twinx()
color2 = "oc.blue5"
ax2.set_ylabel("Sine", color=color2, fontsize=dm.fs(0))
ax2.plot(x, y2, color=color2, lw=0.7, label="Sin")
ax2.tick_params(axis="y", labelcolor=color2)

ax1.set_title("Dual Axis Example", fontsize=dm.fs(1))

# Combine legends (Optional)
# lines1, labels1 = ax1.get_legend_handles_labels()
# lines2, labels2 = ax2.get_legend_handles_labels()
# ax1.legend(lines1 + lines2, labels1 + labels2, loc='best')

dm.simple_layout(fig, gs=gs)
plt.show()
Total running time of the script: (0 minutes 0.770 seconds)