Note
Go to the end to download the full example code.
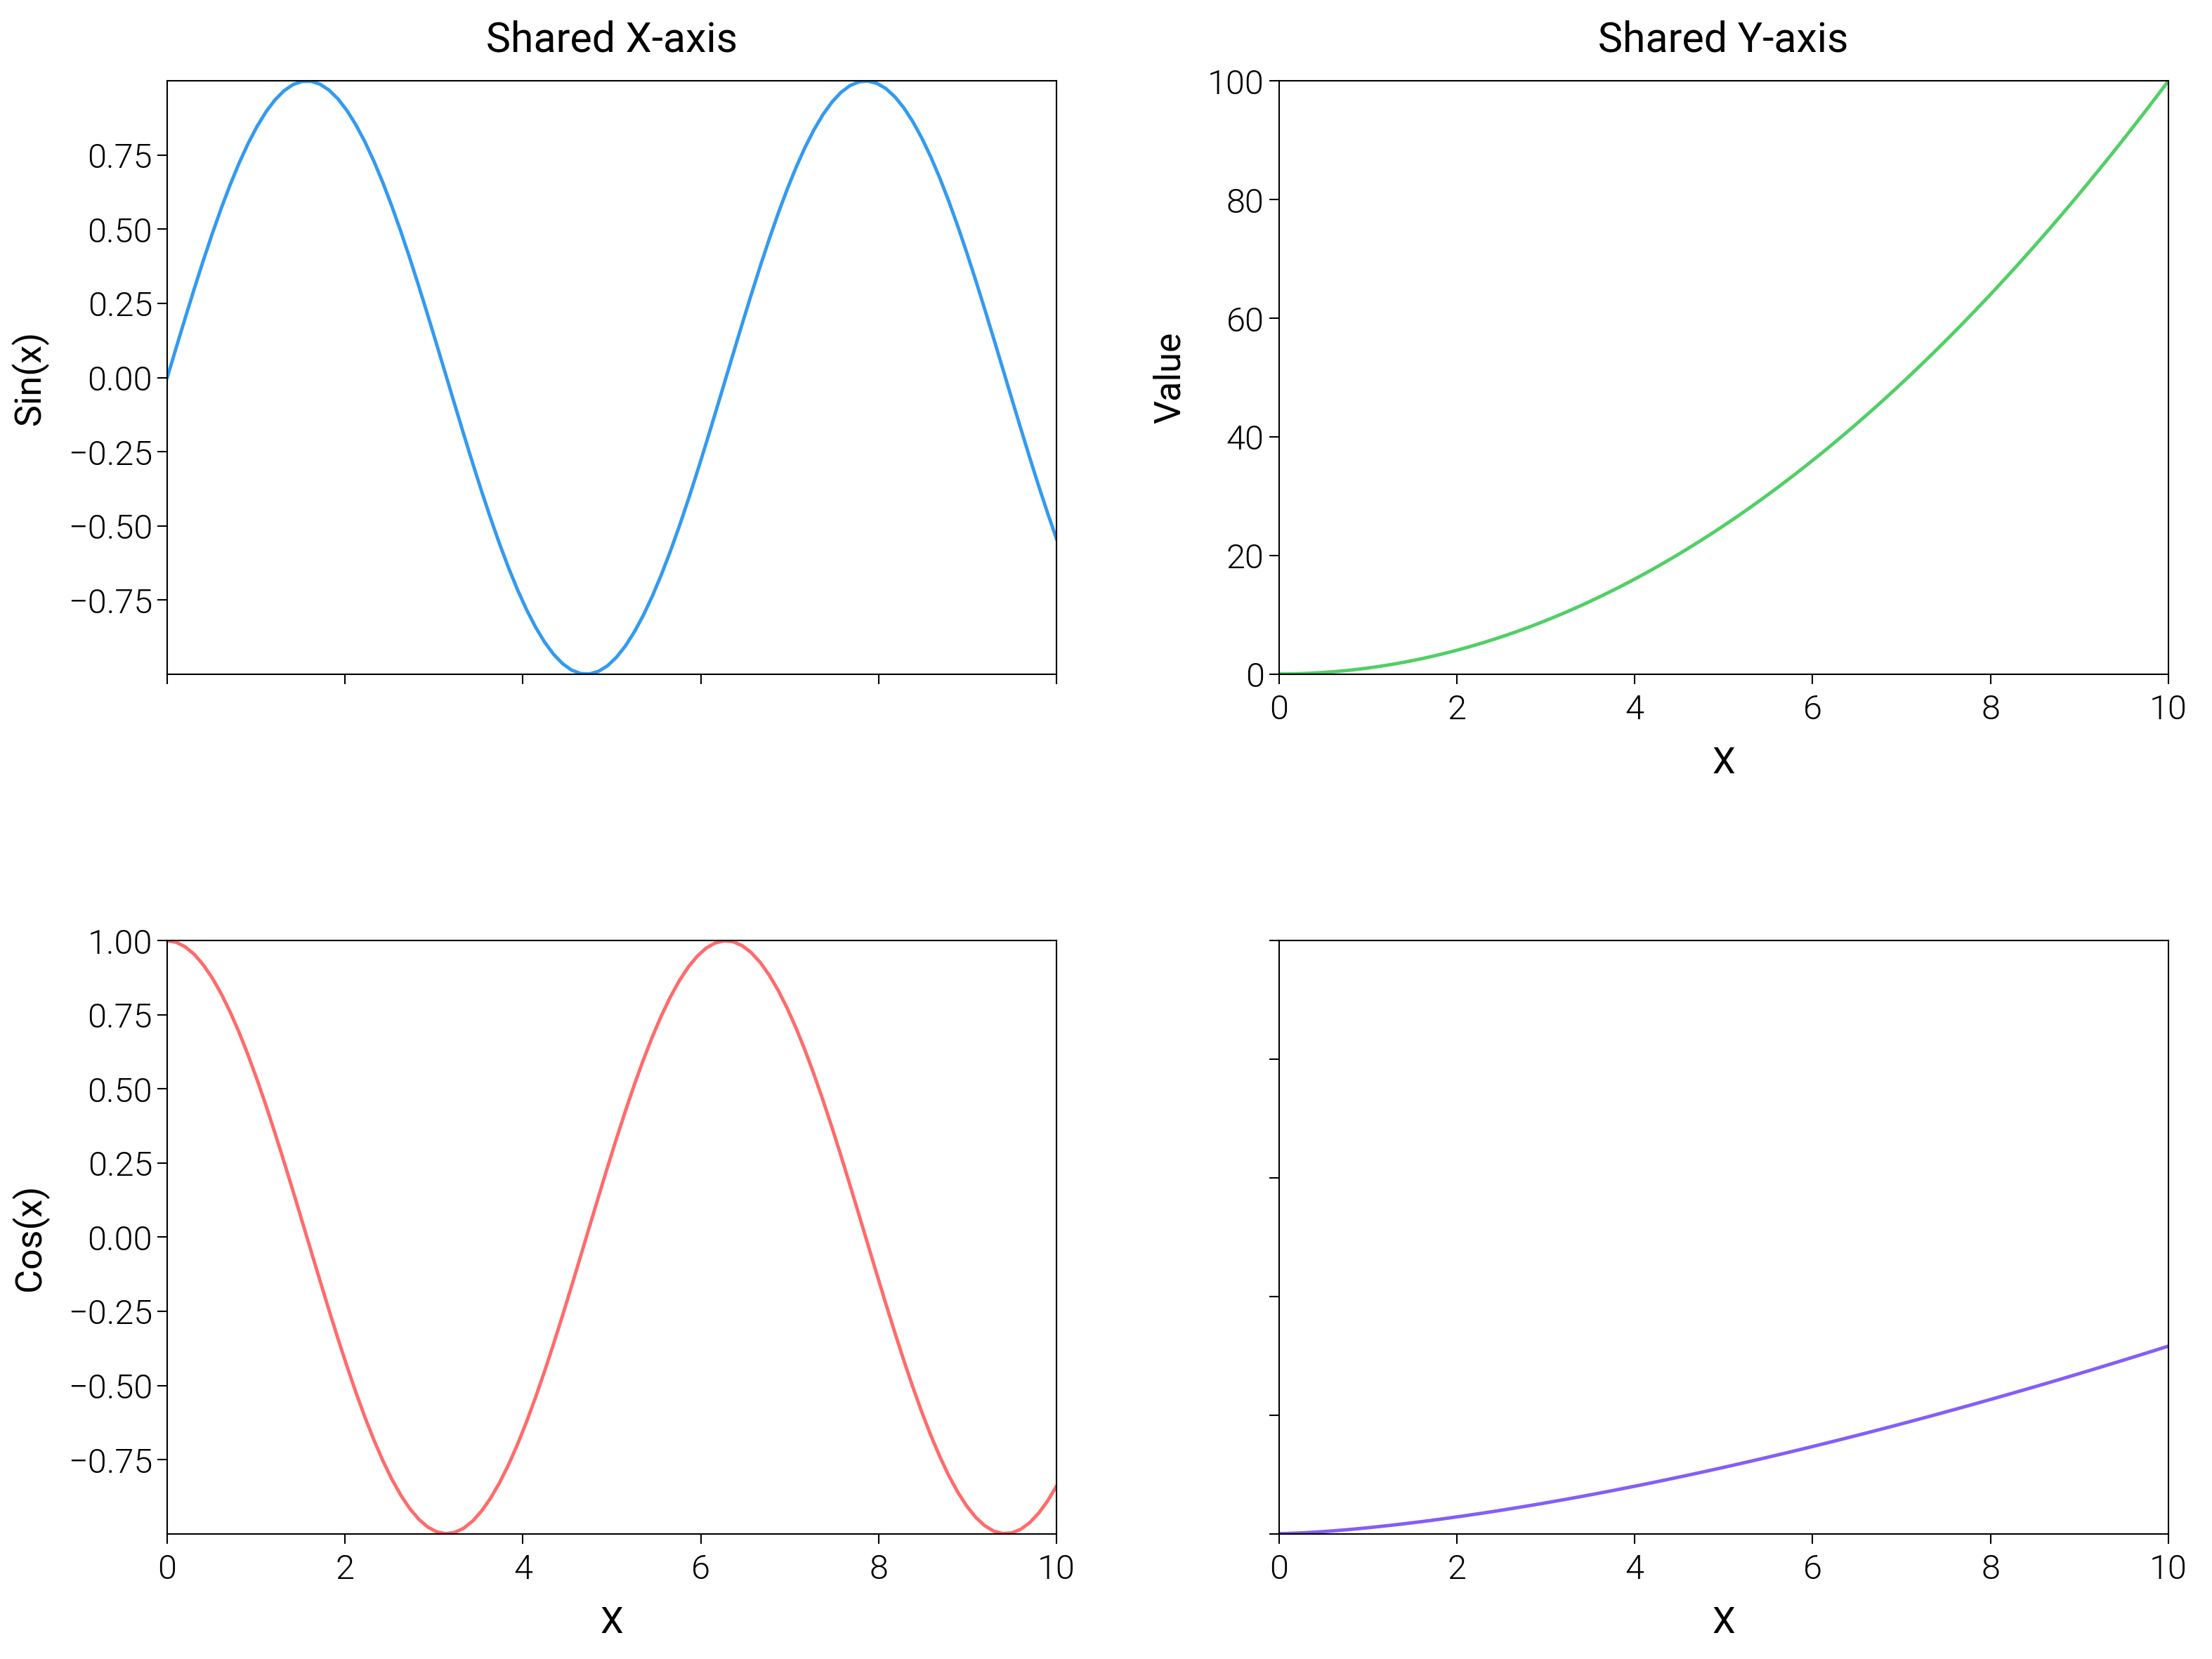
Shared Axes
Share axes for fair comparisons and control label visibility to avoid duplication.
import matplotlib.pyplot as plt
import numpy as np

import dartwork_mpl as dm

dm.style.use("scientific")

np.random.seed(42)
x = np.linspace(0, 10, 100)

fig = plt.figure(figsize=(dm.cm2in(16), dm.cm2in(12)), dpi=300)
gs = fig.add_gridspec(
    nrows=2,
    ncols=2,
    left=0.10,
    right=0.98,
    top=0.95,
    bottom=0.08,
    wspace=0.25,
    hspace=0.45,
)

# Panel A & B: Shared x-axis
ax1 = fig.add_subplot(gs[0, 0])
ax1.plot(x, np.sin(x), color="oc.blue5", lw=0.7)
ax1.set_ylabel("Sin(x)", fontsize=dm.fs(0))
ax1.set_title("Shared X-axis", fontsize=dm.fs(1))
ax1.tick_params(labelbottom=False)

ax2 = fig.add_subplot(gs[1, 0], sharex=ax1)
ax2.plot(x, np.cos(x), color="oc.red5", lw=0.7)
ax2.set_xlabel("X", fontsize=dm.fs(0))
ax2.set_ylabel("Cos(x)", fontsize=dm.fs(0))

# Panel C & D: Shared y-axis
ax3 = fig.add_subplot(gs[0, 1])
ax3.plot(x, x**2, color="oc.green5", lw=0.7)
ax3.set_xlabel("X", fontsize=dm.fs(0))
ax3.set_ylabel("Value", fontsize=dm.fs(0))
ax3.set_title("Shared Y-axis", fontsize=dm.fs(1))

ax4 = fig.add_subplot(gs[1, 1], sharey=ax3)
ax4.plot(x, x**1.5, color="oc.violet5", lw=0.7)
ax4.set_xlabel("X", fontsize=dm.fs(0))
ax4.tick_params(labelleft=False)

dm.simple_layout(fig, gs=gs)
plt.show()
Total running time of the script: (0 minutes 1.938 seconds)