Note
Go to the end to download the full example code.
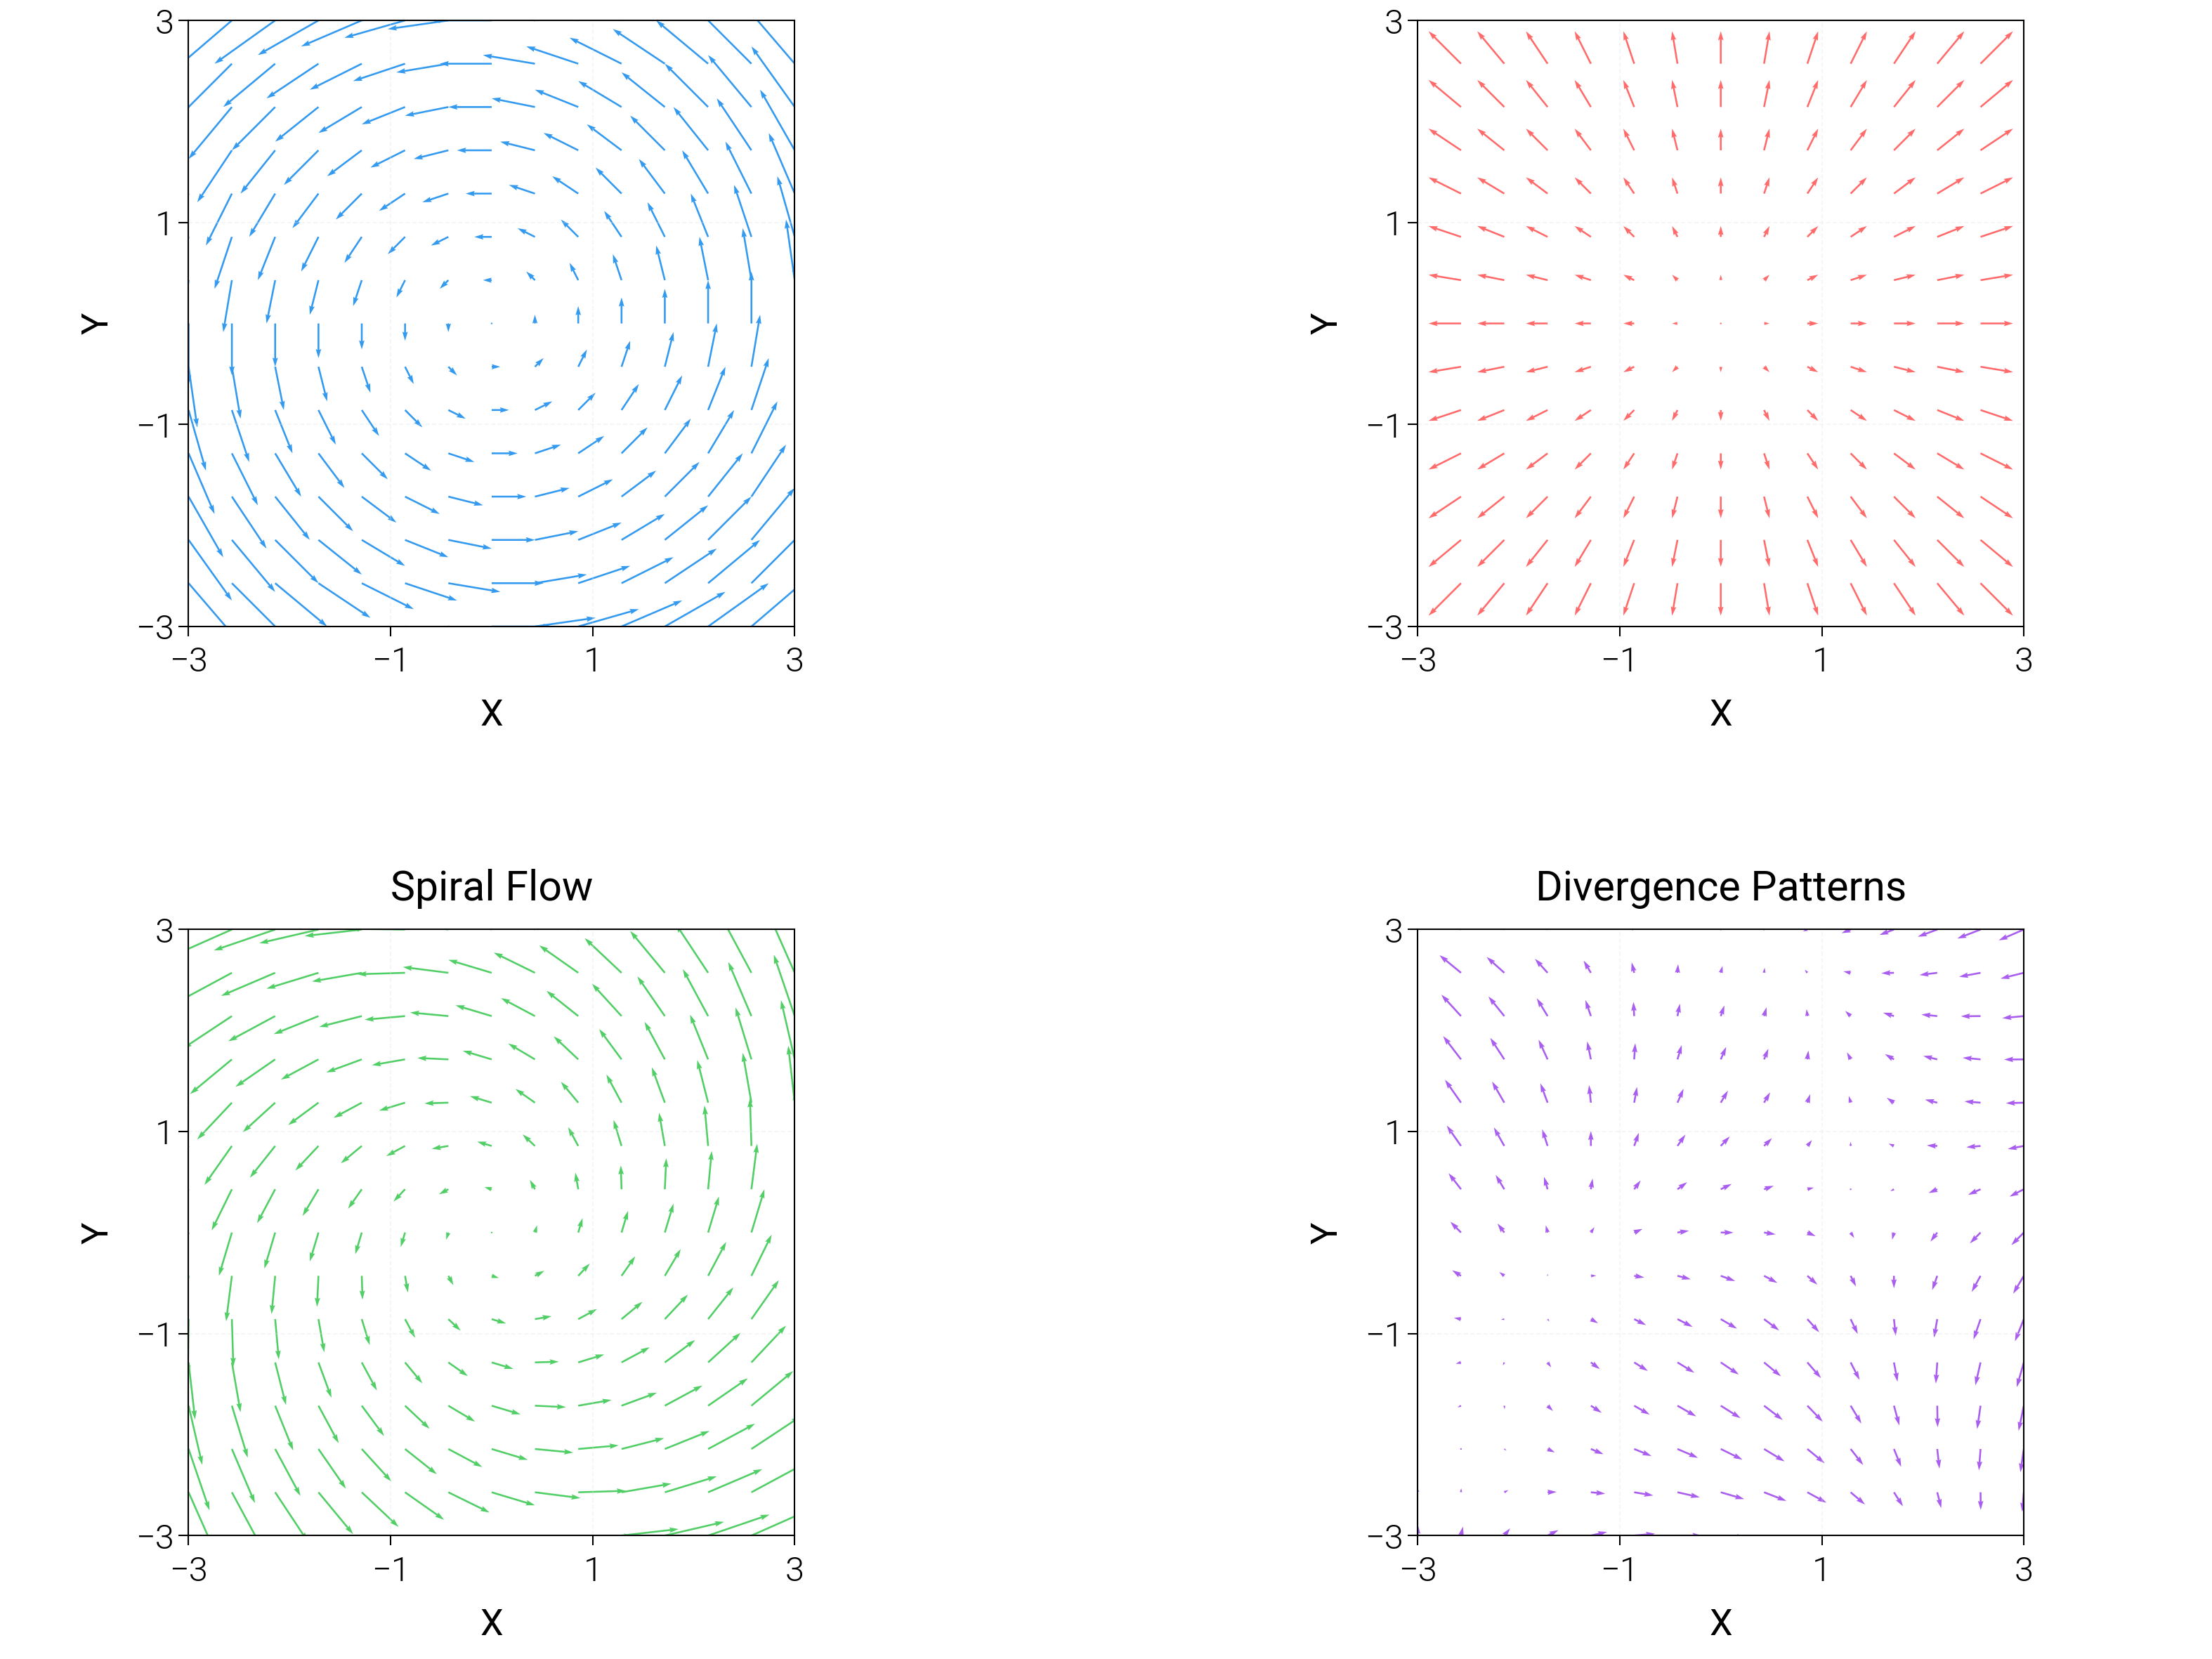
Quiver Plots
Compare radial, circular, and spiral vector fields with clear arrow scaling and color magnitude.
import matplotlib.pyplot as plt
import numpy as np

import dartwork_mpl as dm

# Apply scientific style preset
# Default: font.size=7.5, lines.linewidth=0.5, axes.linewidth=0.3
dm.style.use("scientific")

# Generate vector field data
x = np.linspace(-3, 3, 15)
y = np.linspace(-3, 3, 15)
X, Y = np.meshgrid(x, y)

# Vector field: circular flow
U = -Y
V = X

# Vector field: radial flow
U2 = X
V2 = Y

# Vector field: spiral flow
U3 = -Y + 0.3 * X
V3 = X + 0.3 * Y

# Create figure (square-ish): 16 cm wide, 12 cm tall
fig = plt.figure(figsize=(dm.cm2in(16), dm.cm2in(12)), dpi=300)

# Create GridSpec for 4 subplots (2x2)
gs = fig.add_gridspec(
    nrows=2,
    ncols=2,
    left=0.08,
    right=0.98,
    top=0.92,
    bottom=0.12,
    wspace=0.25,
    hspace=0.5,
)

# Panel A: Basic quiver plot
ax1 = fig.add_subplot(gs[0, 0])
# Explicit parameters: scale=5, width=0.003, color
ax1.quiver(
    X,
    Y,
    U,
    V,
    color="oc.blue5",
    scale=5,
    width=0.003,
    angles="xy",
    scale_units="xy",
)
ax1.set_xlabel("X", fontsize=dm.fs(0))
ax1.set_ylabel("Y", fontsize=dm.fs(0))
ax1.set_title("Circular Flow", fontsize=dm.fs(1))
ax1.set_aspect("equal")
ax1.set_xticks([-3, -1, 1, 3])
ax1.set_yticks([-3, -1, 1, 3])
ax1.grid(True, linestyle="--", linewidth=0.3, alpha=0.3)

# Panel B: Radial flow
ax2 = fig.add_subplot(gs[0, 1])
# Explicit parameters: scale=8, width=0.003
ax2.quiver(
    X,
    Y,
    U2,
    V2,
    color="oc.red5",
    scale=8,
    width=0.003,
    angles="xy",
    scale_units="xy",
)
ax2.set_xlabel("X", fontsize=dm.fs(0))
ax2.set_ylabel("Y", fontsize=dm.fs(0))
ax2.set_title("Radial Flow", fontsize=dm.fs(1))
ax2.set_aspect("equal")
ax2.set_xticks([-3, -1, 1, 3])
ax2.set_yticks([-3, -1, 1, 3])
ax2.grid(True, linestyle="--", linewidth=0.3, alpha=0.3)

# Panel C: Spiral flow
ax3 = fig.add_subplot(gs[1, 0])
# Explicit parameters: scale=6, width=0.003
ax3.quiver(
    X,
    Y,
    U3,
    V3,
    color="oc.green5",
    scale=6,
    width=0.003,
    angles="xy",
    scale_units="xy",
)
ax3.set_xlabel("X", fontsize=dm.fs(0))
ax3.set_ylabel("Y", fontsize=dm.fs(0))
ax3.set_title("Spiral Flow", fontsize=dm.fs(1))
ax3.set_aspect("equal")
ax3.set_xticks([-3, -1, 1, 3])
ax3.set_yticks([-3, -1, 1, 3])
ax3.grid(True, linestyle="--", linewidth=0.3, alpha=0.3)

# Panel D: Divergence field (sinks/sources)
ax4 = fig.add_subplot(gs[1, 1])
U4 = np.cos(X) - Y / 3
V4 = np.sin(Y) - X / 3
ax4.quiver(
    X,
    Y,
    U4,
    V4,
    color="oc.purple5",
    scale=8,
    width=0.003,
    angles="xy",
    scale_units="xy",
)
ax4.set_xlabel("X", fontsize=dm.fs(0))
ax4.set_ylabel("Y", fontsize=dm.fs(0))
ax4.set_title("Divergence Patterns", fontsize=dm.fs(1))
ax4.set_aspect("equal")
ax4.set_xticks([-3, -1, 1, 3])
ax4.set_yticks([-3, -1, 1, 3])
ax4.grid(True, linestyle="--", linewidth=0.3, alpha=0.3)

# Optimize layout
dm.simple_layout(fig, gs=gs)

# Show plot
plt.show()
Total running time of the script: (0 minutes 1.529 seconds)