Note
Go to the end to download the full example code.
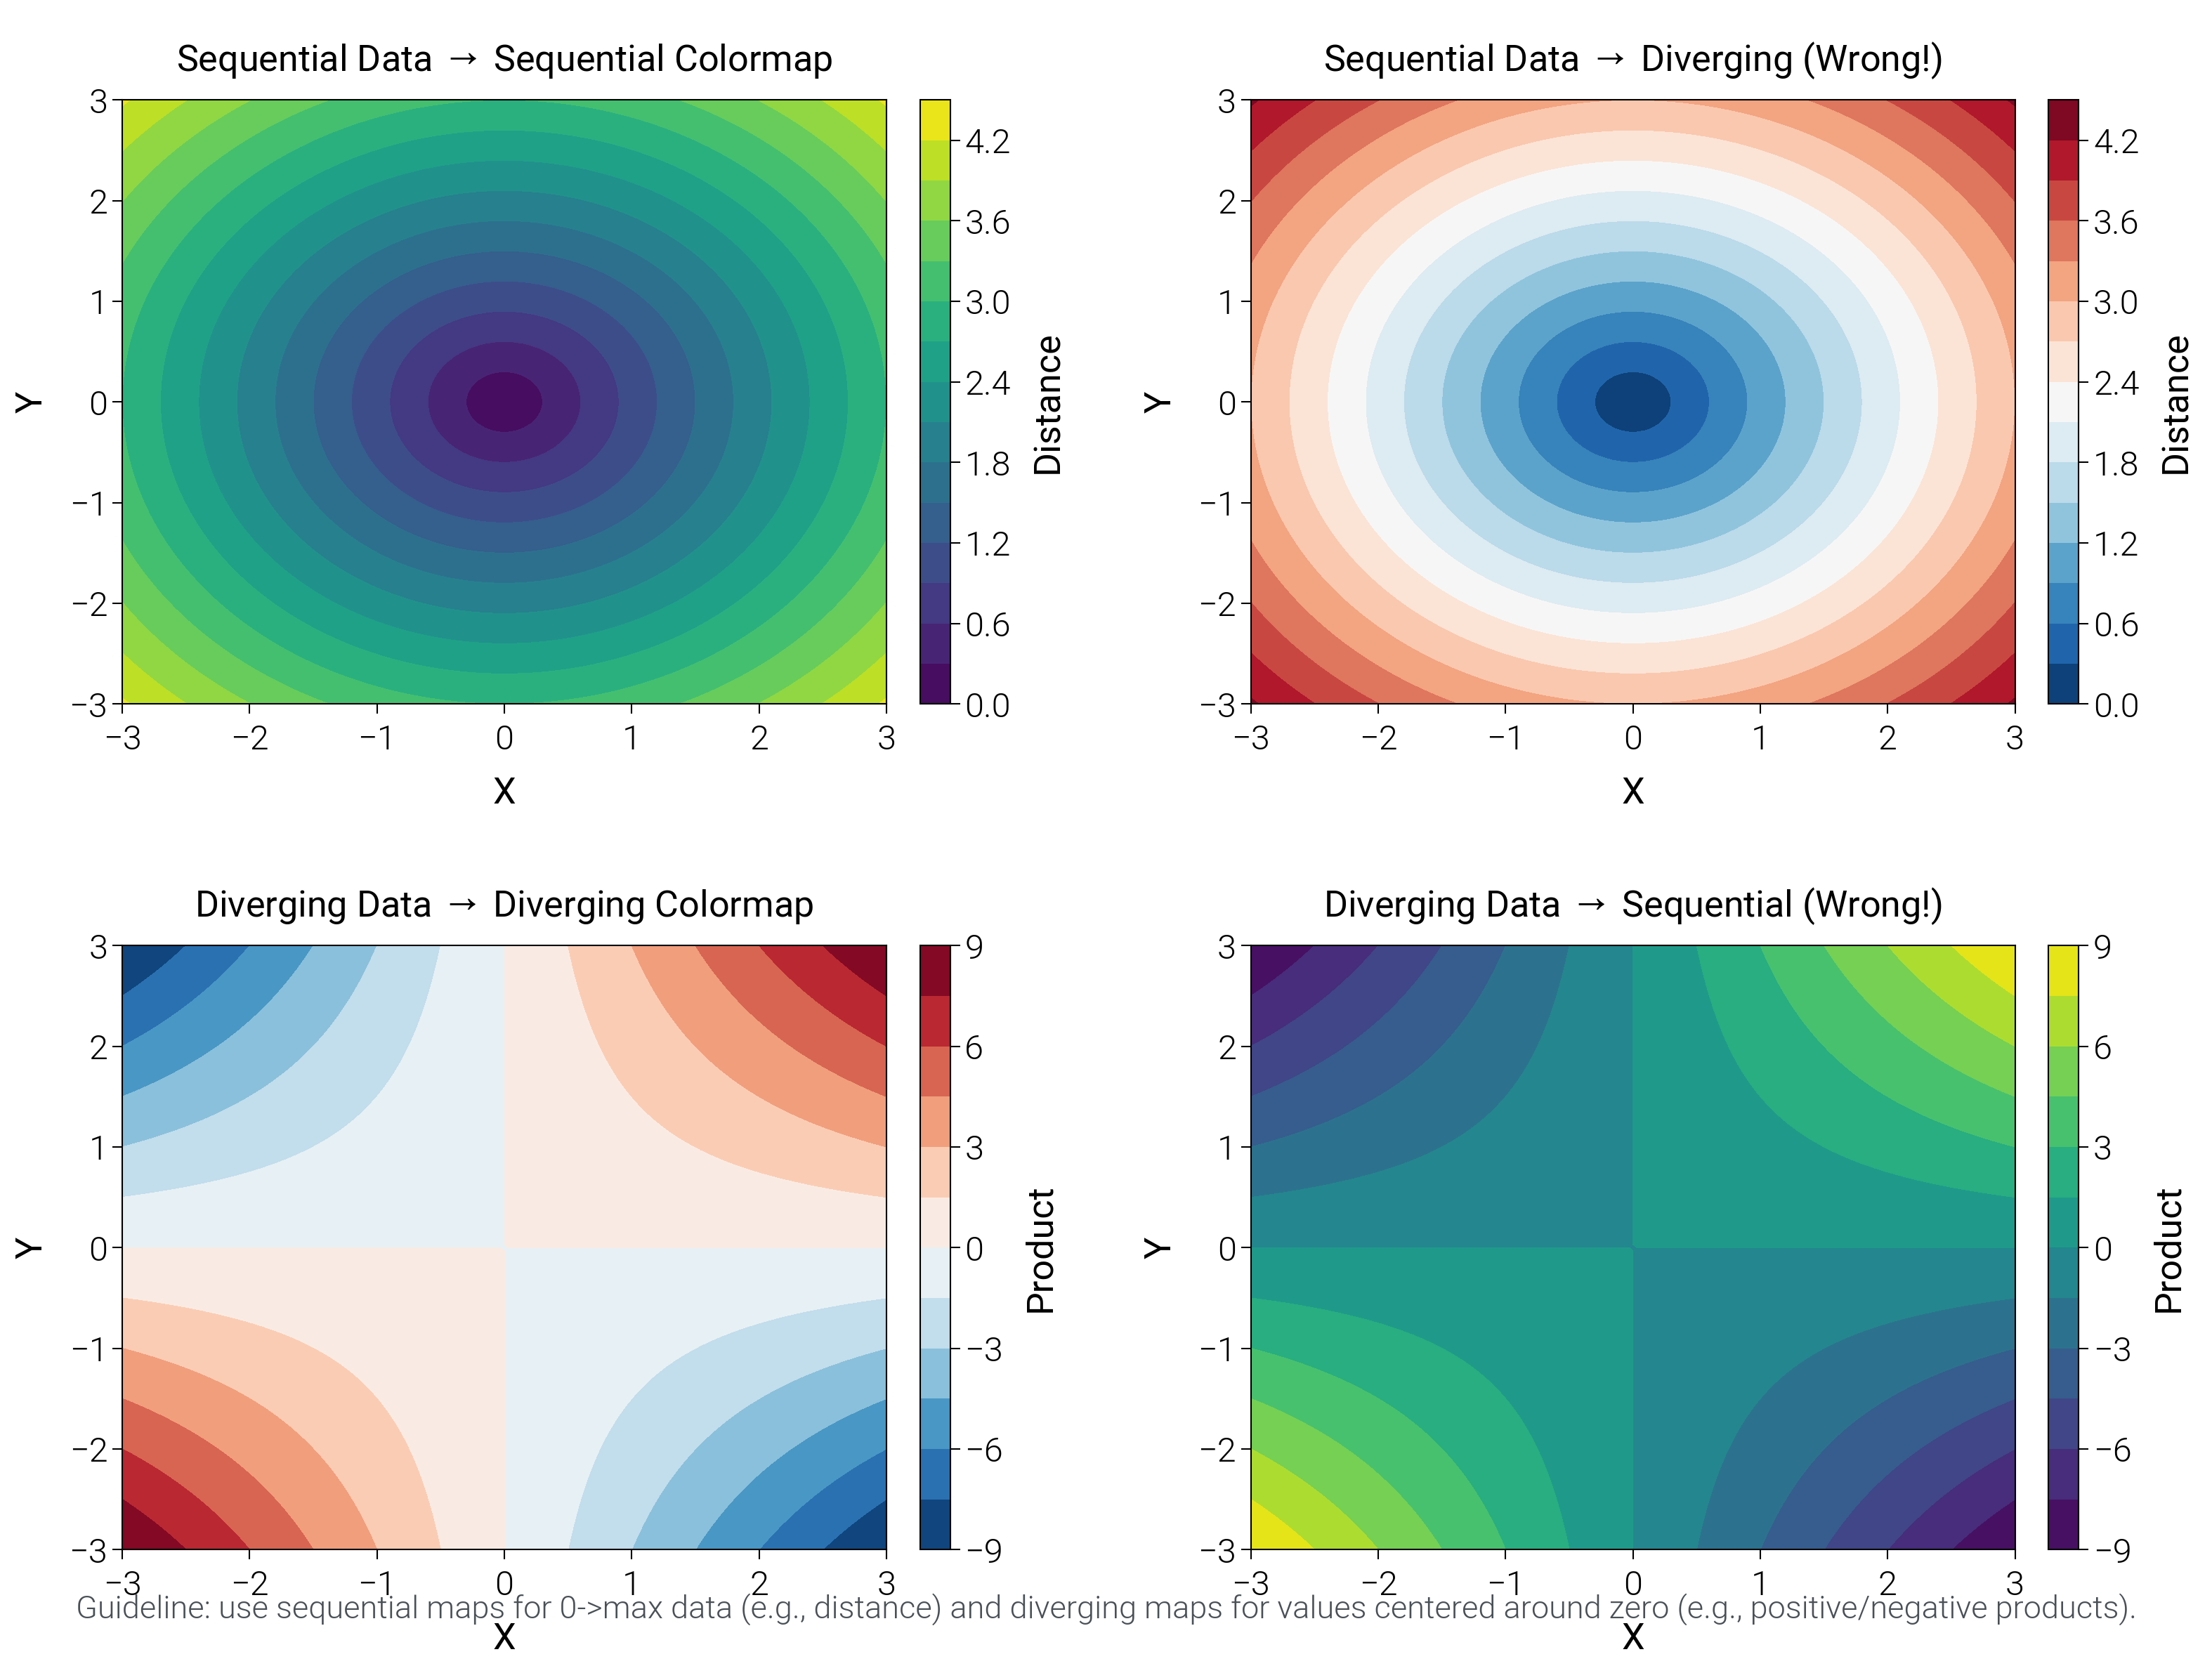
Diverging and Sequential Colors
Choose good color schemes for diverging versus sequential data and see when to use each.
import matplotlib.pyplot as plt
import numpy as np

import dartwork_mpl as dm

dm.style.use("scientific")

# Generate data
x = y = np.linspace(-3, 3, 100)
X, Y = np.meshgrid(x, y)
Z_seq = np.sqrt(X**2 + Y**2)  # Sequential (0 to max)
Z_div = X * Y  # Diverging (negative to positive)

fig = plt.figure(figsize=(dm.cm2in(16), dm.cm2in(12)), dpi=300)
gs = fig.add_gridspec(
    nrows=2,
    ncols=2,
    left=0.08,
    right=0.92,
    top=0.95,
    bottom=0.10,
    wspace=0.35,
    hspace=0.4,
)

# Panel A: Sequential data with sequential colormap
ax1 = fig.add_subplot(gs[0, 0])
im1 = ax1.contourf(X, Y, Z_seq, levels=15, cmap="viridis")
plt.colorbar(im1, ax=ax1, label="Distance", fraction=0.046, pad=0.04)
ax1.set_xlabel("X", fontsize=dm.fs(0))
ax1.set_ylabel("Y", fontsize=dm.fs(0))
ax1.set_title(
    r"Sequential Data $\rightarrow$ Sequential Colormap", fontsize=dm.fs(0)
)

# Panel B: Sequential with wrong colormap (diverging)
ax2 = fig.add_subplot(gs[0, 1])
im2 = ax2.contourf(X, Y, Z_seq, levels=15, cmap="RdBu_r")
plt.colorbar(im2, ax=ax2, label="Distance", fraction=0.046, pad=0.04)
ax2.set_xlabel("X", fontsize=dm.fs(0))
ax2.set_ylabel("Y", fontsize=dm.fs(0))
ax2.set_title(
    r"Sequential Data $\rightarrow$ Diverging (Wrong!)", fontsize=dm.fs(0)
)

# Panel C: Diverging data with diverging colormap
ax3 = fig.add_subplot(gs[1, 0])
im3 = ax3.contourf(X, Y, Z_div, levels=15, cmap="RdBu_r", vmin=-9, vmax=9)
plt.colorbar(im3, ax=ax3, label="Product", fraction=0.046, pad=0.04)
ax3.set_xlabel("X", fontsize=dm.fs(0))
ax3.set_ylabel("Y", fontsize=dm.fs(0))
ax3.set_title(
    r"Diverging Data $\rightarrow$ Diverging Colormap", fontsize=dm.fs(0)
)

# Panel D: Diverging with wrong colormap (sequential)
ax4 = fig.add_subplot(gs[1, 1])
im4 = ax4.contourf(X, Y, Z_div, levels=15, cmap="viridis")
plt.colorbar(im4, ax=ax4, label="Product", fraction=0.046, pad=0.04)
ax4.set_xlabel("X", fontsize=dm.fs(0))
ax4.set_ylabel("Y", fontsize=dm.fs(0))
ax4.set_title(
    r"Diverging Data $\rightarrow$ Sequential (Wrong!)", fontsize=dm.fs(0)
)

fig.text(
    0.5,
    0.03,
    "Guideline: use sequential maps for 0->max data (e.g., distance) and diverging maps for values centered around zero (e.g., positive/negative products).",
    ha="center",
    va="center",
    fontsize=dm.fs(-1),
    color="oc.gray7",
)

dm.simple_layout(fig, gs=gs)
plt.show()
Total running time of the script: (0 minutes 2.238 seconds)