Note
Go to the end to download the full example code.
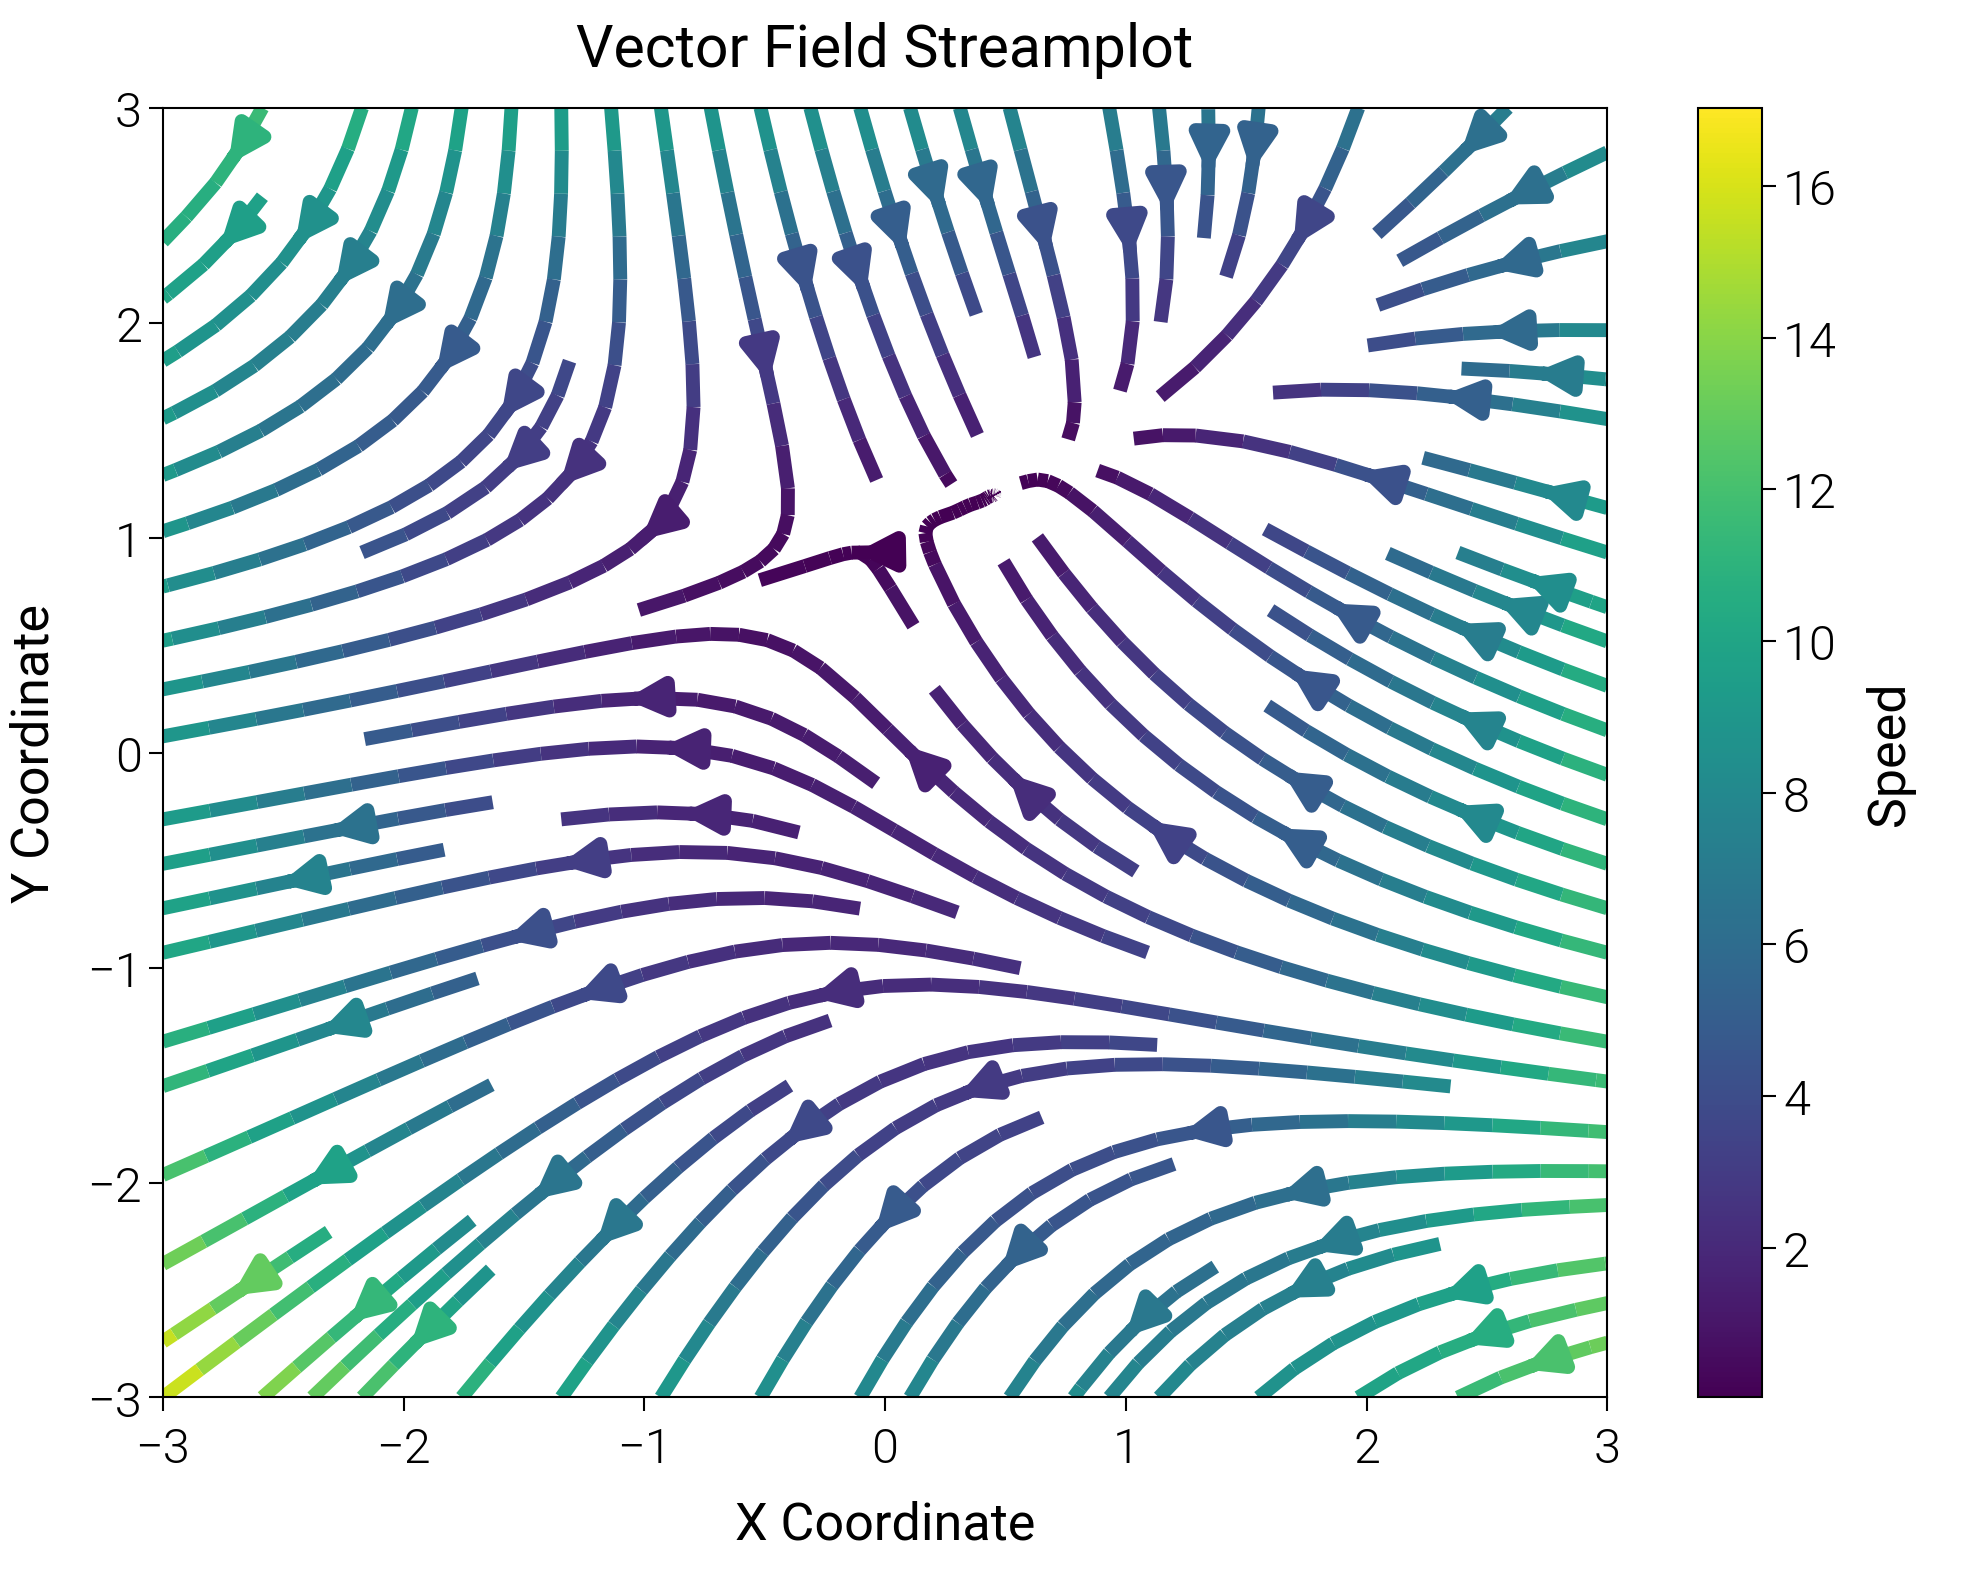
Streamplot
Draw dense vector flows with streamplot spacing, color by speed, and helpful start points.
import matplotlib.pyplot as plt
import numpy as np

import dartwork_mpl as dm

# Apply scientific style
dm.style.use("scientific")

# Generate vector field
Y, X = np.mgrid[-3:3:100j, -3:3:100j]
U = -1 - X**2 + Y
V = 1 + X - Y**2
speed = np.sqrt(U**2 + V**2)

fig = plt.figure(figsize=(dm.cm2in(10), dm.cm2in(8)), dpi=300)
gs = fig.add_gridspec(1, 1, left=0.12, right=0.88, top=0.92, bottom=0.12)
ax = fig.add_subplot(gs[0, 0])

# Streamplot
# Use dartwork-mpl's viridis colormap
strm = ax.streamplot(X, Y, U, V, color=speed, linewidth=2, cmap="dm.viridis")

# Add colorbar
cbar = fig.colorbar(strm.lines, ax=ax)
cbar.set_label("Speed", fontsize=dm.fs(0))

ax.set_title("Vector Field Streamplot", fontsize=dm.fs(1))
ax.set_xlabel("X Coordinate", fontsize=dm.fs(0))
ax.set_ylabel("Y Coordinate", fontsize=dm.fs(0))

dm.simple_layout(fig, gs=gs)
plt.show()
Total running time of the script: (0 minutes 2.170 seconds)