Note
Go to the end to download the full example code.
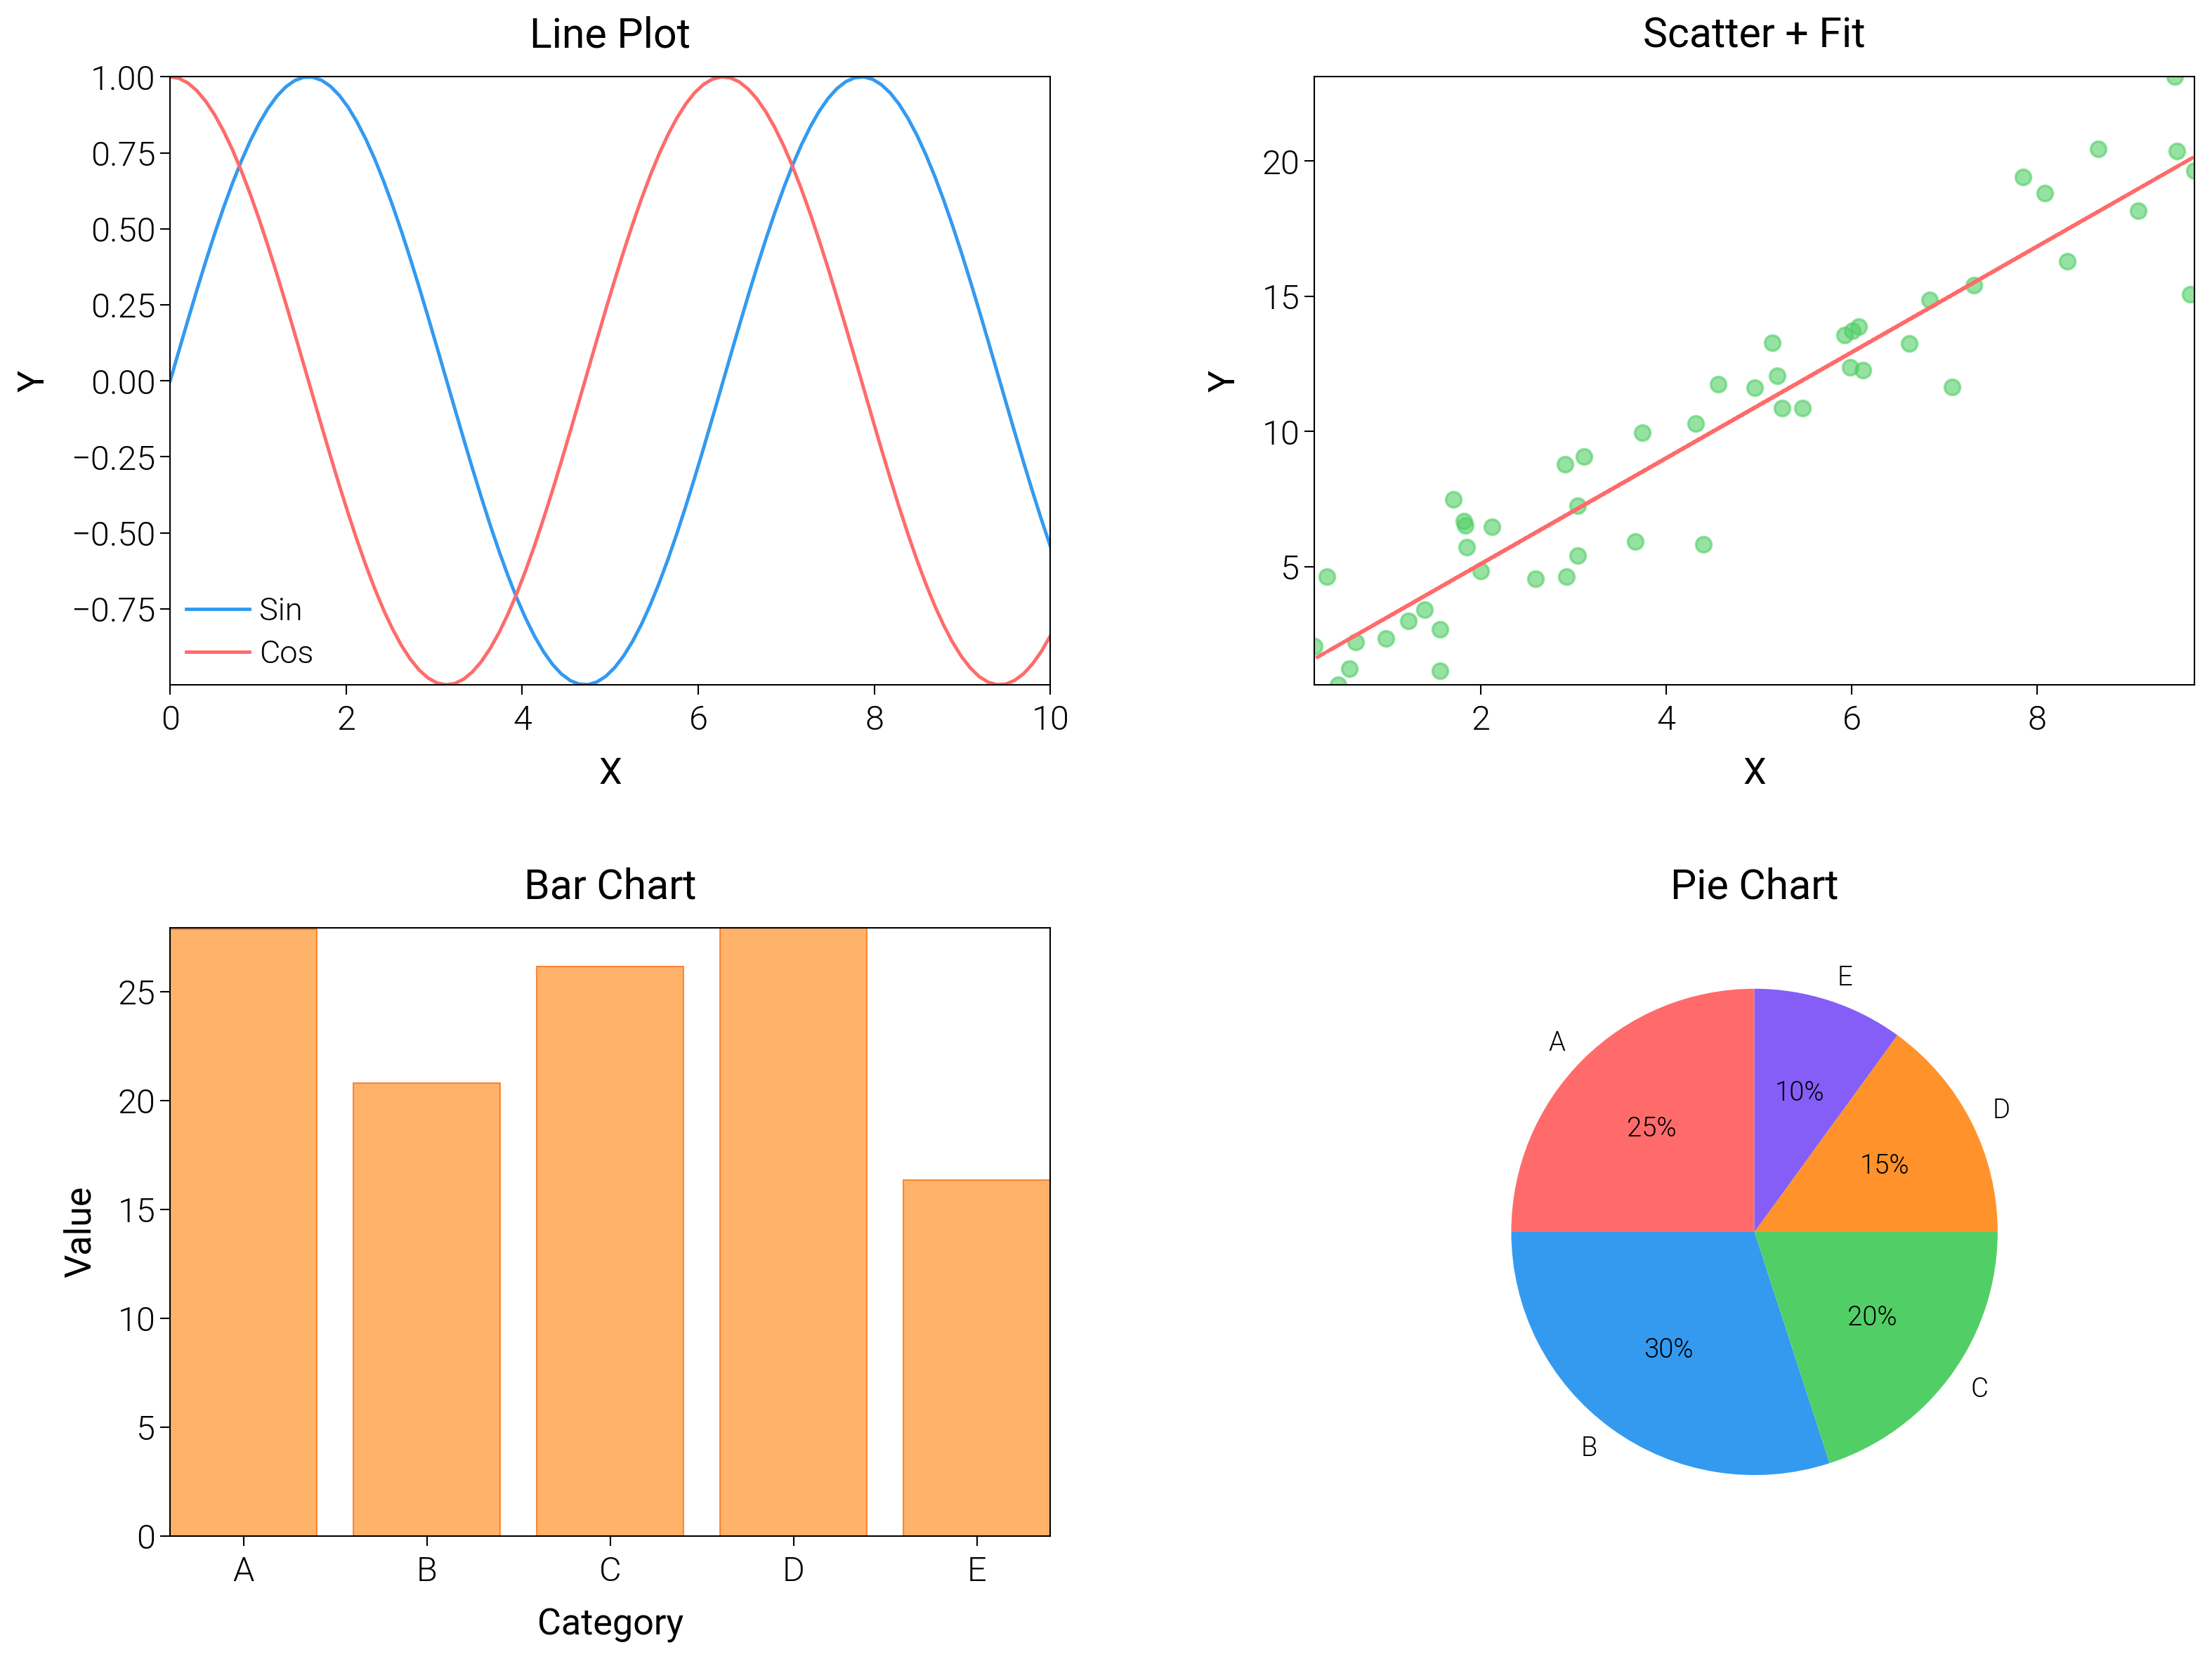
Mixed Subplot Types
Mix bars, lines, histograms, and tabular panels on one page with consistent sizing.
import matplotlib.pyplot as plt
import numpy as np

import dartwork_mpl as dm

dm.style.use("scientific")

np.random.seed(42)

fig = plt.figure(figsize=(dm.cm2in(16), dm.cm2in(12)), dpi=300)
gs = fig.add_gridspec(
    nrows=2,
    ncols=2,
    left=0.08,
    right=0.98,
    top=0.95,
    bottom=0.08,
    wspace=0.3,
    hspace=0.4,
)

# Panel A: Line plot
ax1 = fig.add_subplot(gs[0, 0])
x = np.linspace(0, 10, 100)
ax1.plot(x, np.sin(x), color="oc.blue5", lw=0.7, label="Sin")
ax1.plot(x, np.cos(x), color="oc.red5", lw=0.7, label="Cos")
ax1.set_xlabel("X", fontsize=dm.fs(0))
ax1.set_ylabel("Y", fontsize=dm.fs(0))
ax1.set_title("Line Plot", fontsize=dm.fs(1))
ax1.legend(loc="best", fontsize=dm.fs(-1))

# Panel B: Scatter with regression
ax2 = fig.add_subplot(gs[0, 1])
x_scatter = np.random.rand(50) * 10
y_scatter = 2 * x_scatter + 1 + np.random.randn(50) * 2
ax2.scatter(x_scatter, y_scatter, c="oc.green5", s=10, alpha=0.6)
z = np.polyfit(x_scatter, y_scatter, 1)
p = np.poly1d(z)
ax2.plot(x_scatter, p(x_scatter), color="oc.red5", lw=0.7, linestyle="--")
ax2.set_xlabel("X", fontsize=dm.fs(0))
ax2.set_ylabel("Y", fontsize=dm.fs(0))
ax2.set_title("Scatter + Fit", fontsize=dm.fs(1))

# Panel C: Bar chart
ax3 = fig.add_subplot(gs[1, 0])
categories = ["A", "B", "C", "D", "E"]
values = np.random.rand(5) * 20 + 10
ax3.bar(
    categories,
    values,
    color="oc.orange5",
    alpha=0.7,
    edgecolor="oc.orange7",
    linewidth=0.3,
)
ax3.set_xlabel("Category", fontsize=dm.fs(0))
ax3.set_ylabel("Value", fontsize=dm.fs(0))
ax3.set_title("Bar Chart", fontsize=dm.fs(1))

# Panel D: Pie chart
ax4 = fig.add_subplot(gs[1, 1])
sizes = [25, 30, 20, 15, 10]
colors_pie = ["oc.red5", "oc.blue5", "oc.green5", "oc.orange5", "oc.violet5"]
ax4.pie(
    sizes,
    labels=categories,
    colors=colors_pie,
    autopct="%1.0f%%",
    startangle=90,
    textprops={"fontsize": dm.fs(-2)},
)
ax4.set_title("Pie Chart", fontsize=dm.fs(1))

dm.simple_layout(fig, gs=gs)
plt.show()
Total running time of the script: (0 minutes 2.191 seconds)