Note
Go to the end to download the full example code.
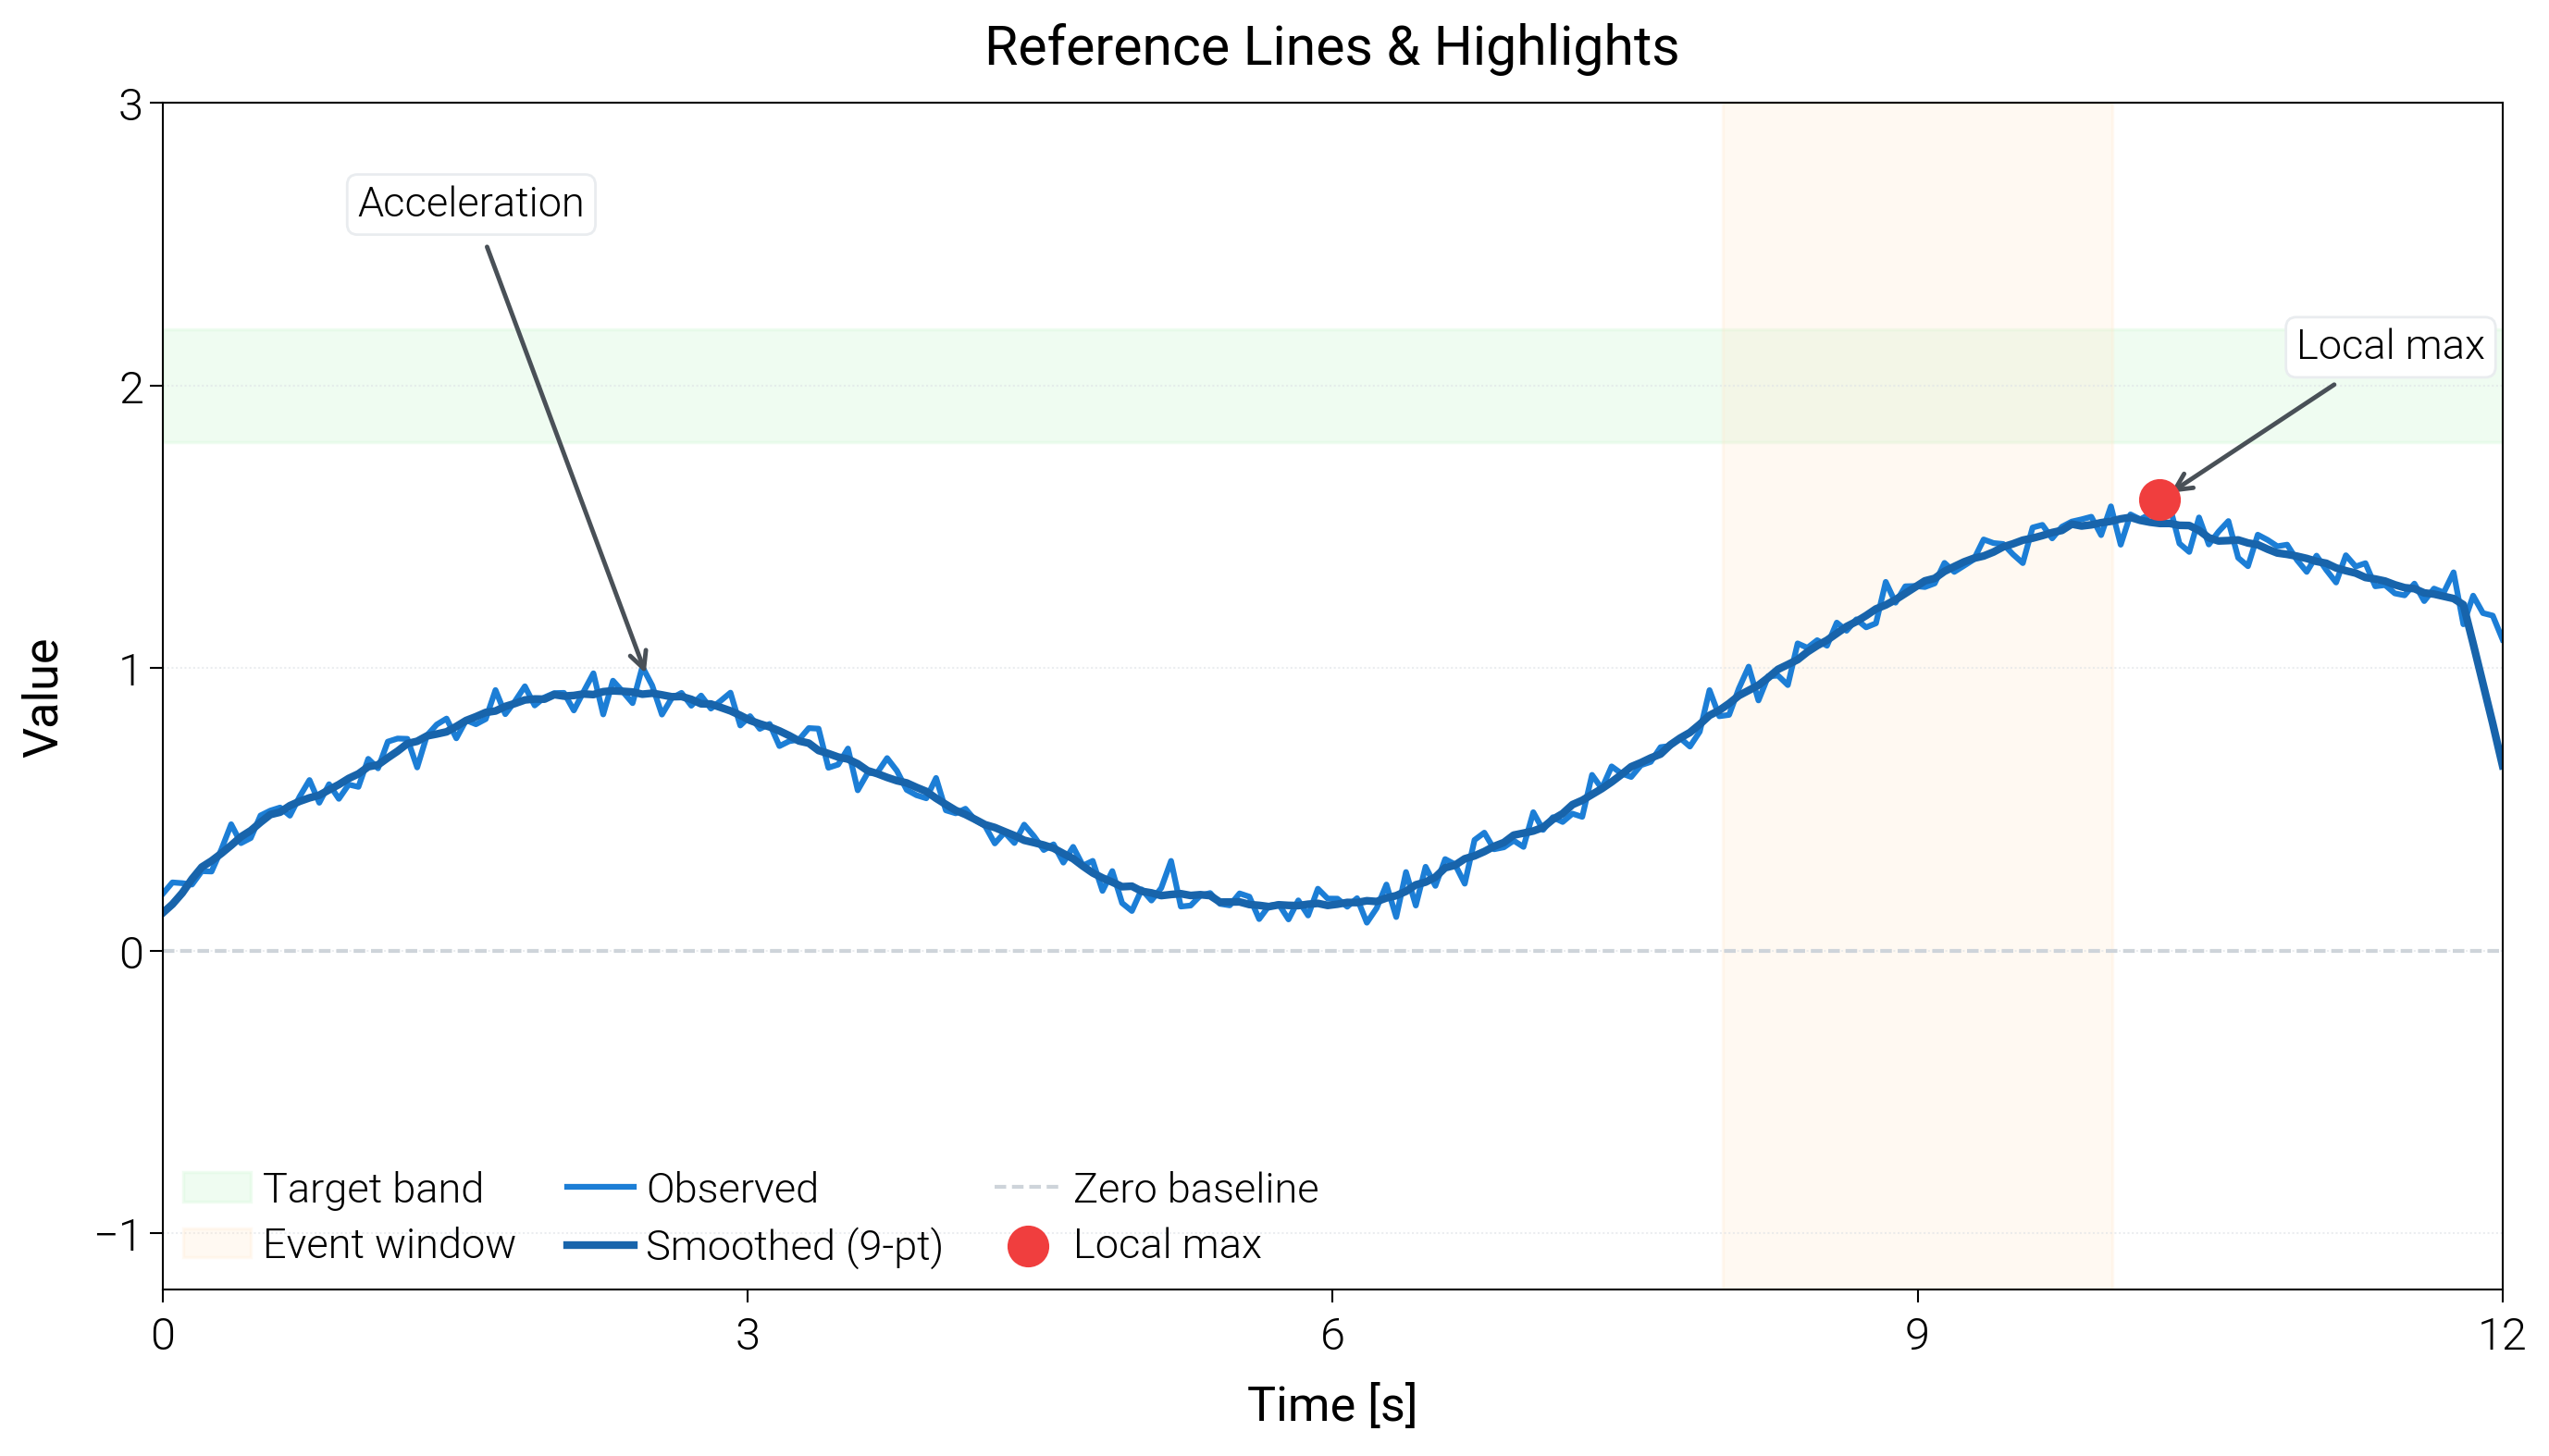
Reference Lines
Combine baseline trends, goal bands, annotations, and highlights to show how dartwork-mpl styles compose on a single axes.
import matplotlib.pyplot as plt
import numpy as np

import dartwork_mpl as dm

dm.style.use("scientific")

# Synthetic signal with slow trend and oscillation
x = np.linspace(0, 12, 240)
trend = 0.12 * x
wiggle = 0.5 * np.sin(0.8 * x) + 0.2 * np.cos(0.3 * x)
noise = 0.05 * np.random.default_rng(7).standard_normal(x.size)
y = trend + wiggle + noise
smooth = np.convolve(y, np.ones(9) / 9, mode="same")

fig = plt.figure(figsize=(dm.cm2in(14), dm.cm2in(8)), dpi=300)
gs = fig.add_gridspec(1, 1, left=0.12, right=0.97, top=0.9, bottom=0.18)
ax = fig.add_subplot(gs[0, 0])

# Goal band and period highlight
ax.axhspan(1.8, 2.2, color="oc.green1", alpha=0.35, label="Target band")
ax.axvspan(8, 10, color="oc.orange1", alpha=0.25, label="Event window")

# Series, smooth trend, and reference line
ax.plot(x, y, color="oc.blue7", lw=0.9, label="Observed")
ax.plot(x, smooth, color="oc.blue9", lw=1.2, label="Smoothed (9-pt)")
ax.hlines(
    0, 0, 12, color="oc.gray4", lw=0.6, linestyle="--", label="Zero baseline"
)

# Annotations for peak and slope start
peak_idx = np.argmax(y)
ax.scatter(
    x[peak_idx], y[peak_idx], color="oc.red7", s=36, zorder=4, label="Local max"
)
ax.annotate(
    "Local max",
    xy=(x[peak_idx], y[peak_idx]),
    xytext=(x[peak_idx] + 0.7, y[peak_idx] + 0.5),
    arrowprops={"arrowstyle": "->", "color": "oc.gray7", "lw": 0.7},
    fontsize=dm.fs(-1),
    bbox={
        "boxstyle": "round,pad=0.25",
        "fc": "white",
        "ec": "oc.gray2",
        "lw": 0.4,
    },
)
ax.annotate(
    "Acceleration",
    xy=(2.5, y[np.searchsorted(x, 2.5)]),
    xytext=(1.0, 2.6),
    arrowprops={"arrowstyle": "->", "color": "oc.gray7", "lw": 0.7},
    fontsize=dm.fs(-1),
    bbox={
        "boxstyle": "round,pad=0.25",
        "fc": "white",
        "ec": "oc.gray2",
        "lw": 0.4,
    },
)

ax.set_xlabel("Time [s]", fontsize=dm.fs(0))
ax.set_ylabel("Value", fontsize=dm.fs(0))
ax.set_title("Reference Lines & Highlights", fontsize=dm.fs(1))
ax.set_xlim(0, 12)
ax.set_ylim(-1.2, 3)
ax.set_xticks([0, 3, 6, 9, 12])
ax.set_yticks([-1, 0, 1, 2, 3])
ax.grid(axis="y", linestyle=":", color="oc.gray3", alpha=0.6)

ax.legend(
    loc="best",
    ncol=3,
    fontsize=dm.fs(-1),
    frameon=False,
    columnspacing=1.2,
    handlelength=1.6,
)

dm.simple_layout(fig, gs=gs)

plt.show()
Total running time of the script: (0 minutes 0.762 seconds)