Note
Go to the end to download the full example code.
Layout Optimization
Tweak margins, spacings, and aspect ratios using simple_layout and GridSpec helpers.
import matplotlib.pyplot as plt
import dartwork_mpl as dm
# Apply style
dm.style.use("scientific")
# Create a figure with multiple subplots
fig = plt.figure(figsize=(dm.cm2in(15), dm.cm2in(10)), dpi=300)
gs = fig.add_gridspec(
2, 2, left=0.1, right=0.95, top=0.95, bottom=0.1, hspace=0.4, wspace=0.3
)
ax1 = fig.add_subplot(gs[0, 0])
ax2 = fig.add_subplot(gs[0, 1])
ax3 = fig.add_subplot(gs[1, :])
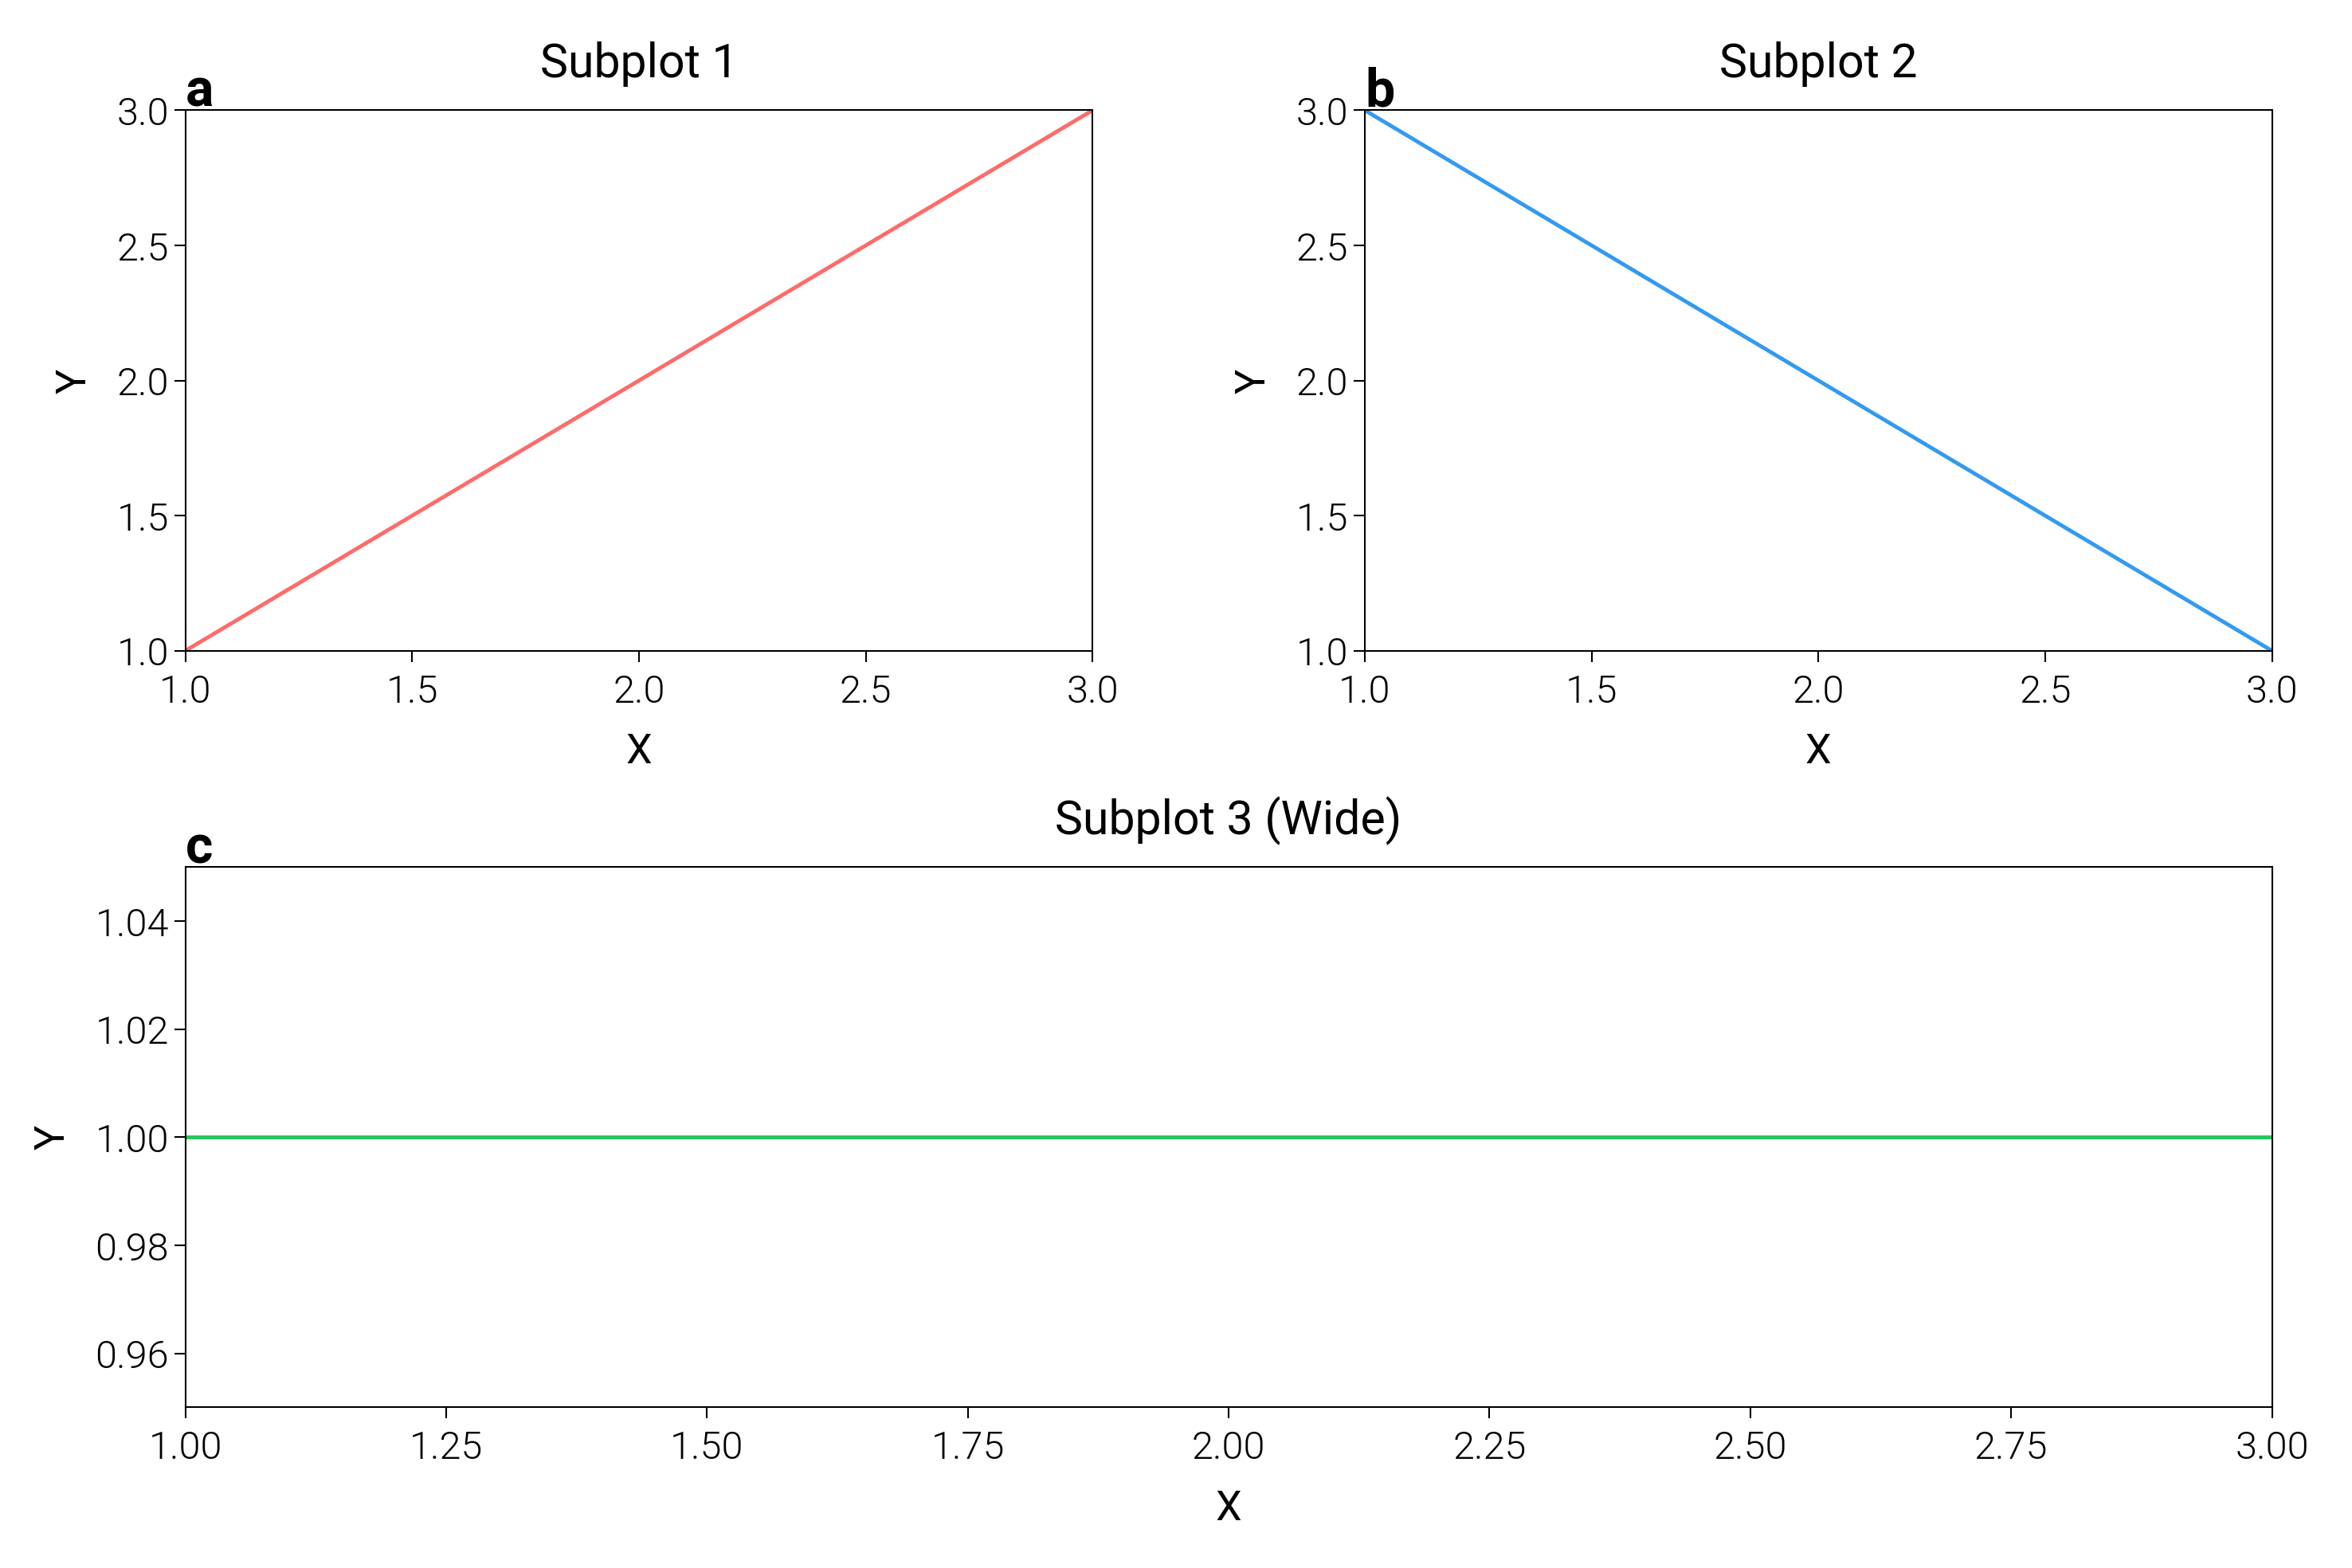
ax1.plot([1, 2, 3], [1, 2, 3], color="oc.red5", lw=0.7)
ax1.set_title("Subplot 1", fontsize=dm.fs(1))
ax1.set_xlabel("X", fontsize=dm.fs(0))
ax1.set_ylabel("Y", fontsize=dm.fs(0))
ax2.plot([1, 2, 3], [3, 2, 1], color="oc.blue5", lw=0.7)
ax2.set_title("Subplot 2", fontsize=dm.fs(1))
ax2.set_xlabel("X", fontsize=dm.fs(0))
ax2.set_ylabel("Y", fontsize=dm.fs(0))
ax3.plot([1, 2, 3], [1, 1, 1], color="tw.green500", lw=0.7)
ax3.set_title("Subplot 3 (Wide)", fontsize=dm.fs(1))
ax3.set_xlabel("X", fontsize=dm.fs(0))
ax3.set_ylabel("Y", fontsize=dm.fs(0))
# Add subplot labels (a, b, c)
for ax, label in zip([ax1, ax2, ax3], "abc", strict=False):
offset = dm.make_offset(0, 8, fig)
ax.text(
0,
1,
label,
transform=ax.transAxes + offset,
weight="bold",
va="top",
fontsize=dm.fs(2),
)
# Optimize layout
# You can adjust margins explicitly
dm.simple_layout(fig, gs=gs, margins=(0.1, 0.1, 0.1, 0.1))
plt.show()
Total running time of the script: (0 minutes 1.595 seconds)