Note
Go to the end to download the full example code.
AI Helper Utilities Usage
This example demonstrates the AI helper utilities in dartwork-mpl’s helpers module. These functions are designed to assist AI agents and automation tools in creating consistent, high-quality visualizations.
import matplotlib.pyplot as plt
import numpy as np

import dartwork_mpl as dm

# Set random seed for reproducibility
np.random.seed(42)
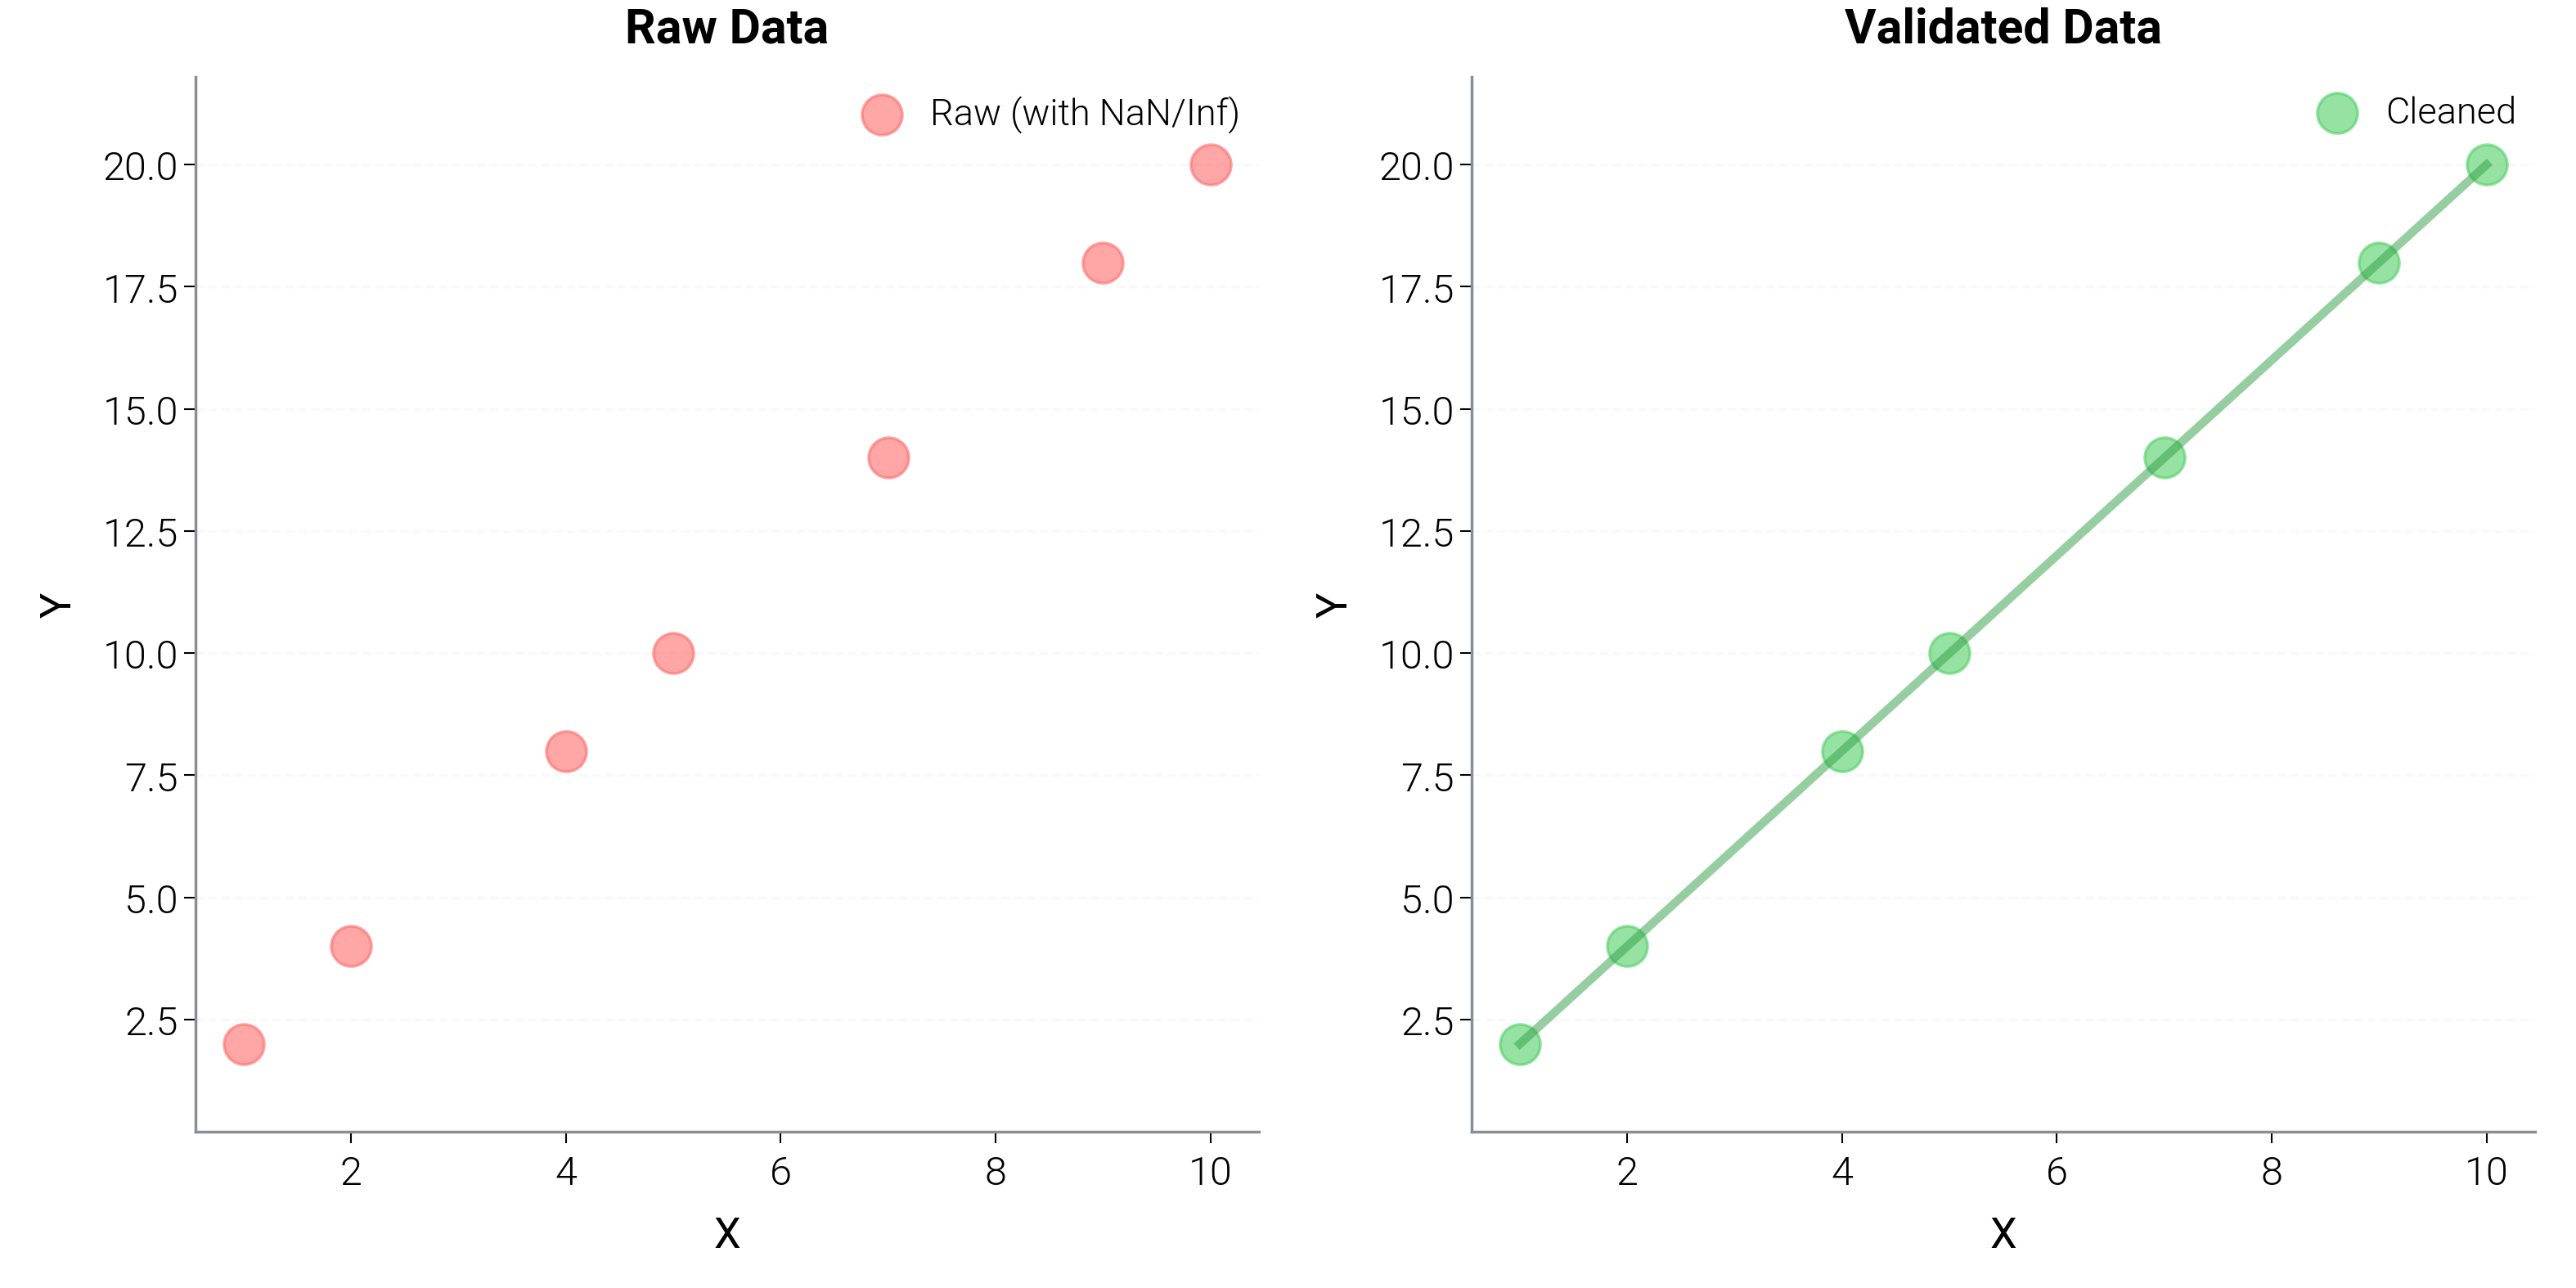
Data Validation
The validate_data function helps clean and prepare data for plotting.
# Create data with some problematic values
x_raw = np.array([1, 2, np.nan, 4, 5, np.inf, 7, 8, 9, 10])
y_raw = np.array([2, 4, 6, 8, 10, 12, 14, np.nan, 18, 20])

print("Raw data shapes and issues:")
print(
    f"X: {x_raw}, has NaN: {np.isnan(x_raw).any()}, has Inf: {np.isinf(x_raw).any()}"
)
print(
    f"Y: {y_raw}, has NaN: {np.isnan(y_raw).any()}, has Inf: {np.isinf(y_raw).any()}"
)

# Validate and clean the data
x_clean, y_clean = dm.helpers.data.validate_data(
    x_raw, y_raw, require_same_length=True, allow_nan=False, min_points=3
)

print(f"\nCleaned data shapes: X: {x_clean.shape}, Y: {y_clean.shape}")
print(f"Cleaned X: {x_clean}")
print(f"Cleaned Y: {y_clean}")

# Plot comparison
dm.style.use("scientific")
fig, (ax1, ax2) = plt.subplots(1, 2, figsize=(dm.cm2in(16), dm.cm2in(8)))

# Raw data (with issues)
ax1.scatter(
    x_raw, y_raw, color="oc.red5", s=50, alpha=0.6, label="Raw (with NaN/Inf)"
)
ax1.set_title("Raw Data", fontsize=dm.fs(1))
ax1.set_xlabel("X", fontsize=dm.fs(0))
ax1.set_ylabel("Y", fontsize=dm.fs(0))
ax1.legend(fontsize=dm.fs(-1))
dm.minimal_axes(ax1)

# Cleaned data
ax2.scatter(
    x_clean, y_clean, color="oc.green5", s=50, alpha=0.6, label="Cleaned"
)
ax2.plot(x_clean, y_clean, color="oc.green8", lw=dm.lw(0.5), alpha=0.5)
ax2.set_title("Validated Data", fontsize=dm.fs(1))
ax2.set_xlabel("X", fontsize=dm.fs(0))
ax2.set_ylabel("Y", fontsize=dm.fs(0))
ax2.legend(fontsize=dm.fs(-1))
dm.minimal_axes(ax2)

dm.simple_layout(fig)
Raw data shapes and issues:
X: [ 1.  2. nan  4.  5. inf  7.  8.  9. 10.], has NaN: True, has Inf: True
Y: [ 2.  4.  6.  8. 10. 12. 14. nan 18. 20.], has NaN: True, has Inf: False
/home/runner/work/dartwork-mpl/dartwork-mpl/docs/examples_source/05_advanced_components/plot_helpers_usage.py:37: UserWarning: Removed 2 NaN/Inf values from data
  x_clean, y_clean = dm.helpers.data.validate_data(
/home/runner/work/dartwork-mpl/dartwork-mpl/docs/examples_source/05_advanced_components/plot_helpers_usage.py:37: UserWarning: Removed 1 NaN/Inf values from data
  x_clean, y_clean = dm.helpers.data.validate_data(

Cleaned data shapes: X: (7,), Y: (7,)
Cleaned X: [ 1.  2.  4.  5.  7.  9. 10.]
Cleaned Y: [ 2.  4.  8. 10. 14. 18. 20.]
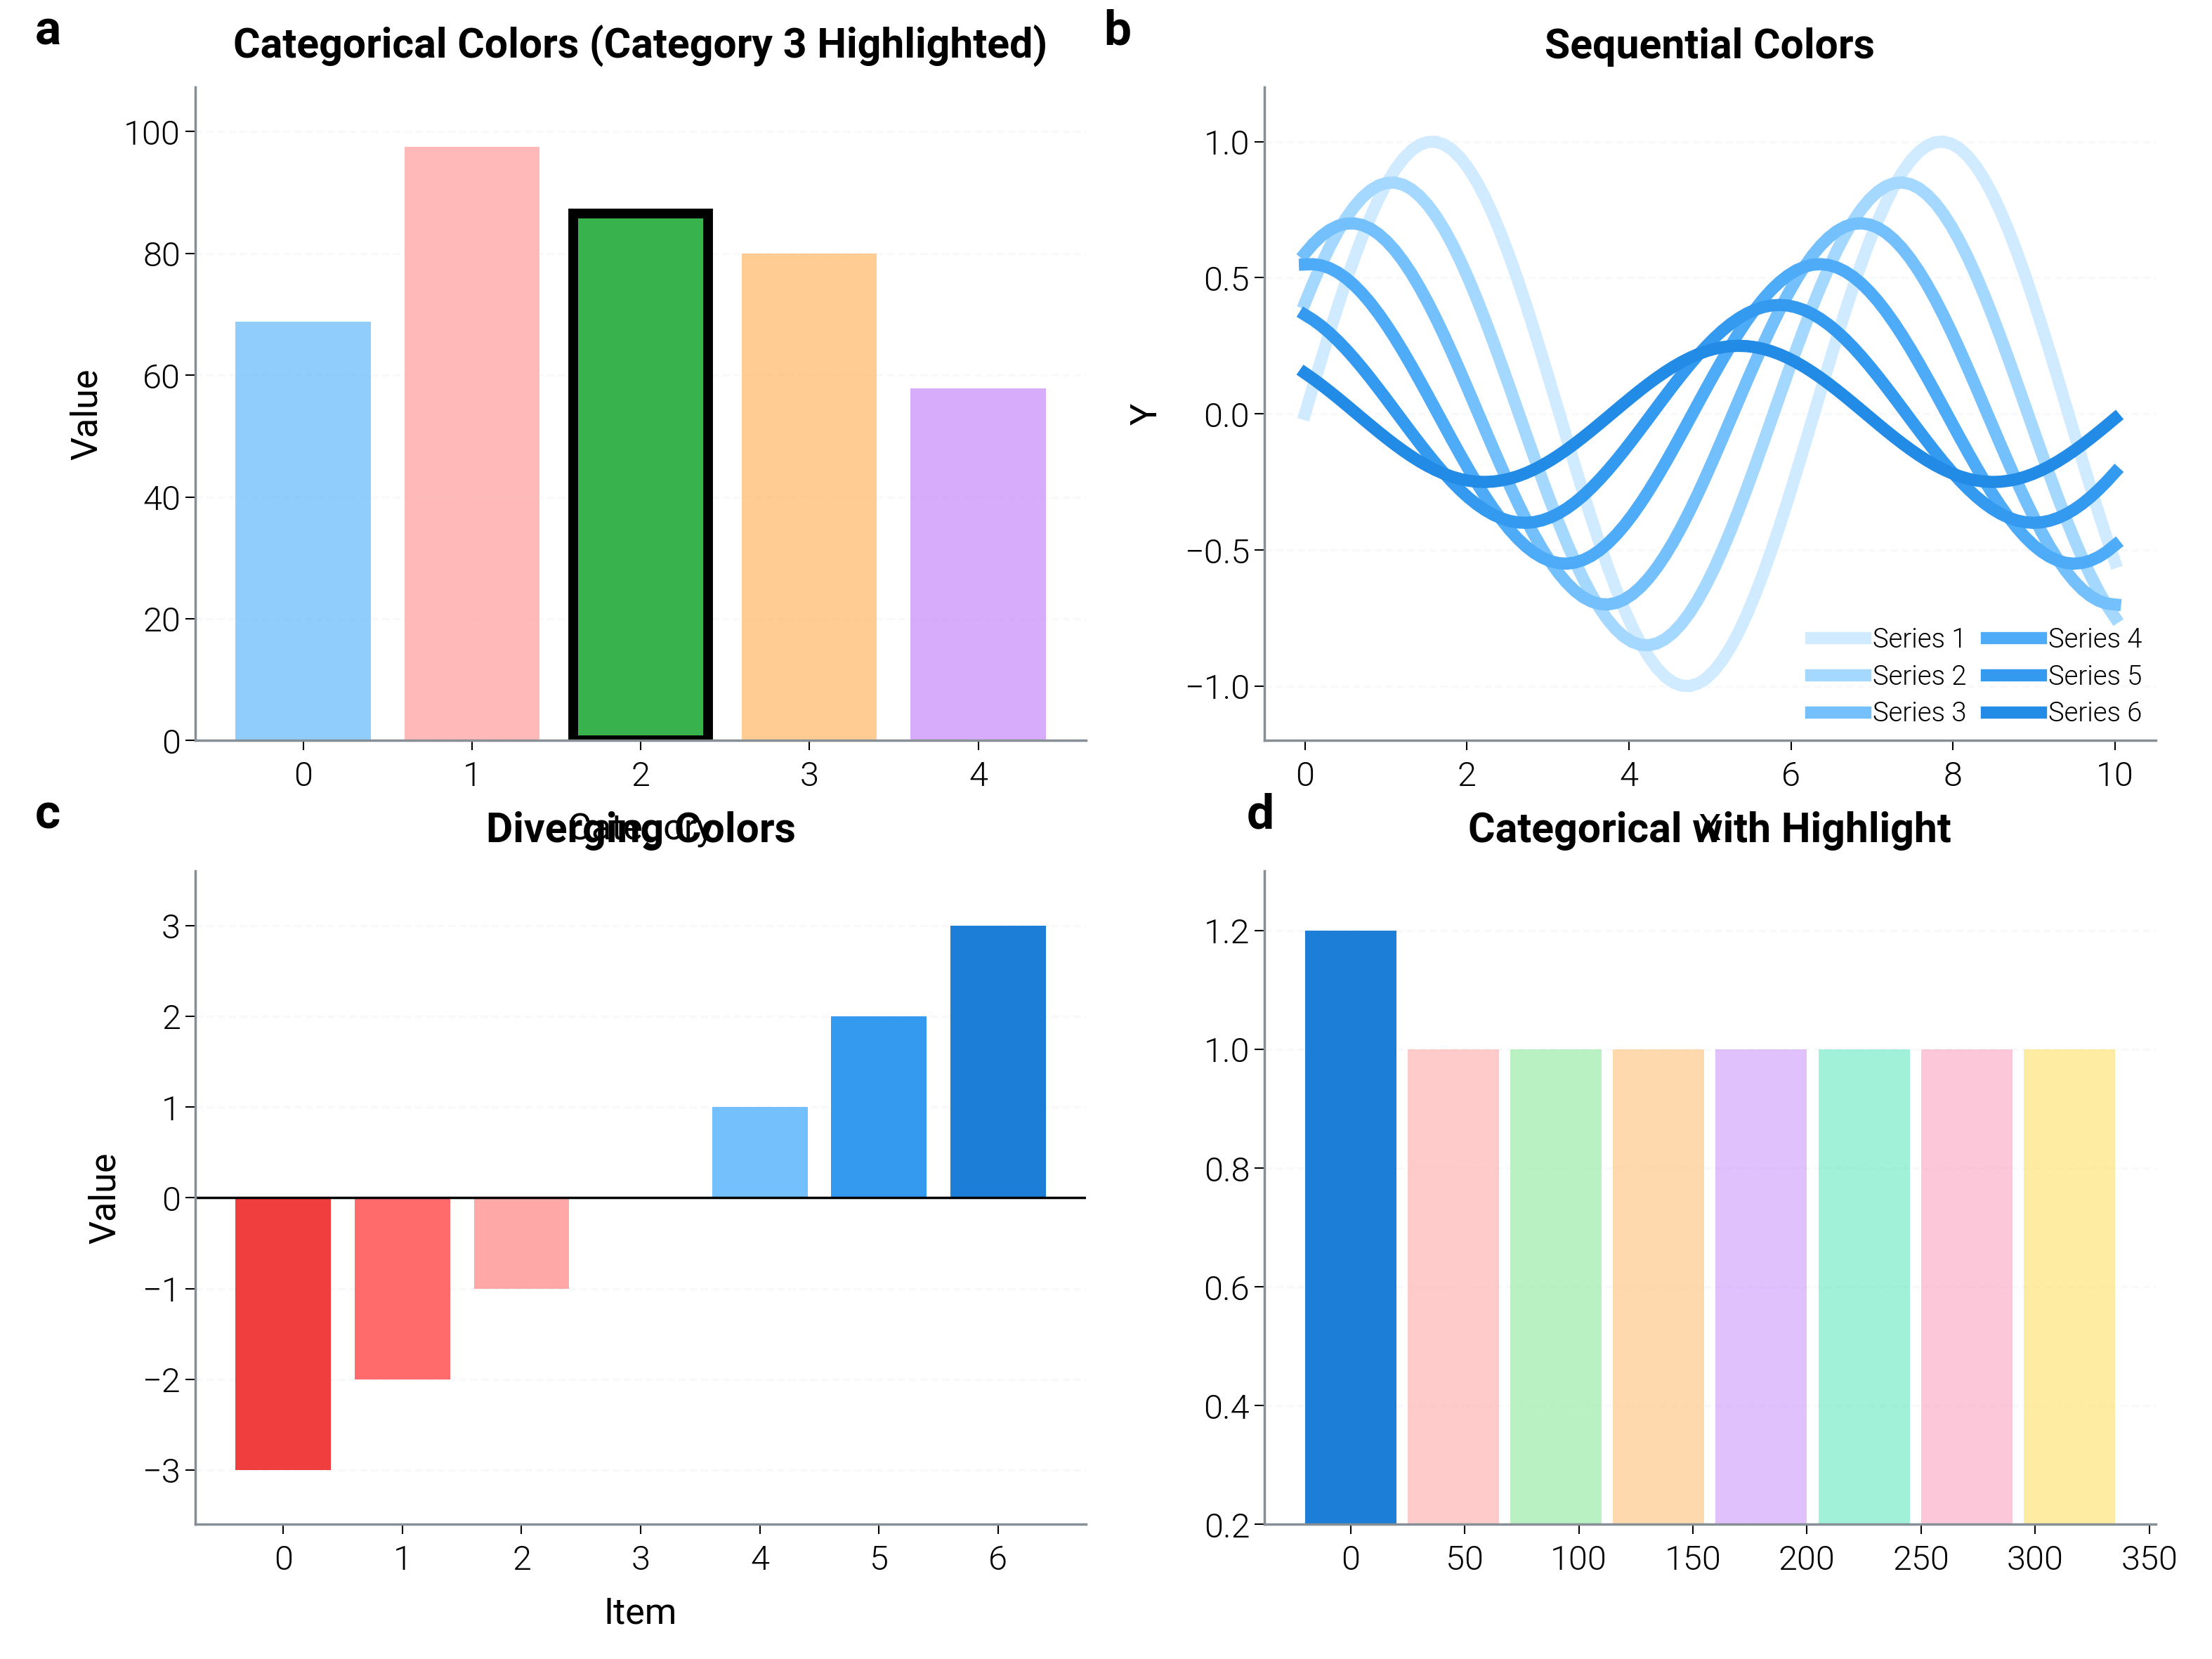
Automatic Color Selection
Auto-select appropriate colors based on data characteristics.
fig, axes = plt.subplots(2, 2, figsize=(dm.cm2in(16), dm.cm2in(12)))

# Qualitative colors for categorical data
ax1 = axes[0, 0]
n_categories = 5
colors_qual = dm.helpers.colors.auto_select_colors(
    n_series=n_categories,
    color_type="categorical",
    highlight_index=2,  # Highlight third category
)

for i, color in enumerate(colors_qual):
    height = np.random.rand() * 50 + 50
    bar = ax1.bar(
        i,
        height,
        color=color,
        alpha=0.8 if i != 2 else 1.0,
        edgecolor="black" if i == 2 else "none",
        linewidth=2 if i == 2 else 0,
    )

ax1.set_title("Categorical Colors (Category 3 Highlighted)", fontsize=dm.fs(1))
ax1.set_xlabel("Category", fontsize=dm.fs(0))
ax1.set_ylabel("Value", fontsize=dm.fs(0))
dm.minimal_axes(ax1)

# Sequential colors for continuous data
ax2 = axes[0, 1]
n_series = 6
colors_seq = dm.helpers.colors.auto_select_colors(
    n_series=n_series, color_type="sequential"
)

x = np.linspace(0, 10, 100)
for i, color in enumerate(colors_seq):
    y = np.sin(x + i * 0.5) * (1 - i * 0.15)
    ax2.plot(x, y, color=color, lw=dm.lw(1.5), label=f"Series {i + 1}")

ax2.set_title("Sequential Colors", fontsize=dm.fs(1))
ax2.set_xlabel("X", fontsize=dm.fs(0))
ax2.set_ylabel("Y", fontsize=dm.fs(0))
ax2.legend(fontsize=dm.fs(-2), ncol=2)
dm.minimal_axes(ax2)

# Diverging colors for bipolar data
ax3 = axes[1, 0]
n_diverging = 7
colors_div = dm.helpers.colors.auto_select_colors(
    n_series=n_diverging, color_type="diverging"
)

values = np.array([-3, -2, -1, 0, 1, 2, 3])
ax3.bar(range(len(values)), values, color=colors_div)
ax3.axhline(y=0, color="black", linestyle="-", lw=0.5)
ax3.set_title("Diverging Colors", fontsize=dm.fs(1))
ax3.set_xlabel("Item", fontsize=dm.fs(0))
ax3.set_ylabel("Value", fontsize=dm.fs(0))
dm.minimal_axes(ax3)

# Mixed with highlight
ax4 = axes[1, 1]
n_mixed = 8
colors_mixed = dm.helpers.colors.auto_select_colors(
    n_series=n_mixed,
    color_type="categorical",
    highlight_index=0,  # Single highlight
)

for i, color in enumerate(colors_mixed):
    angle = i * 45
    radius = 0.8 if i != 0 else 1.0
    ax4.bar(
        angle,
        radius,
        width=40,
        color=color,
        alpha=0.6 if i != 0 else 1.0,
        bottom=0.2,
    )

ax4.set_title("Categorical with Highlight", fontsize=dm.fs(1))
dm.minimal_axes(ax4)

dm.label_axes(axes.flat)
dm.simple_layout(fig)
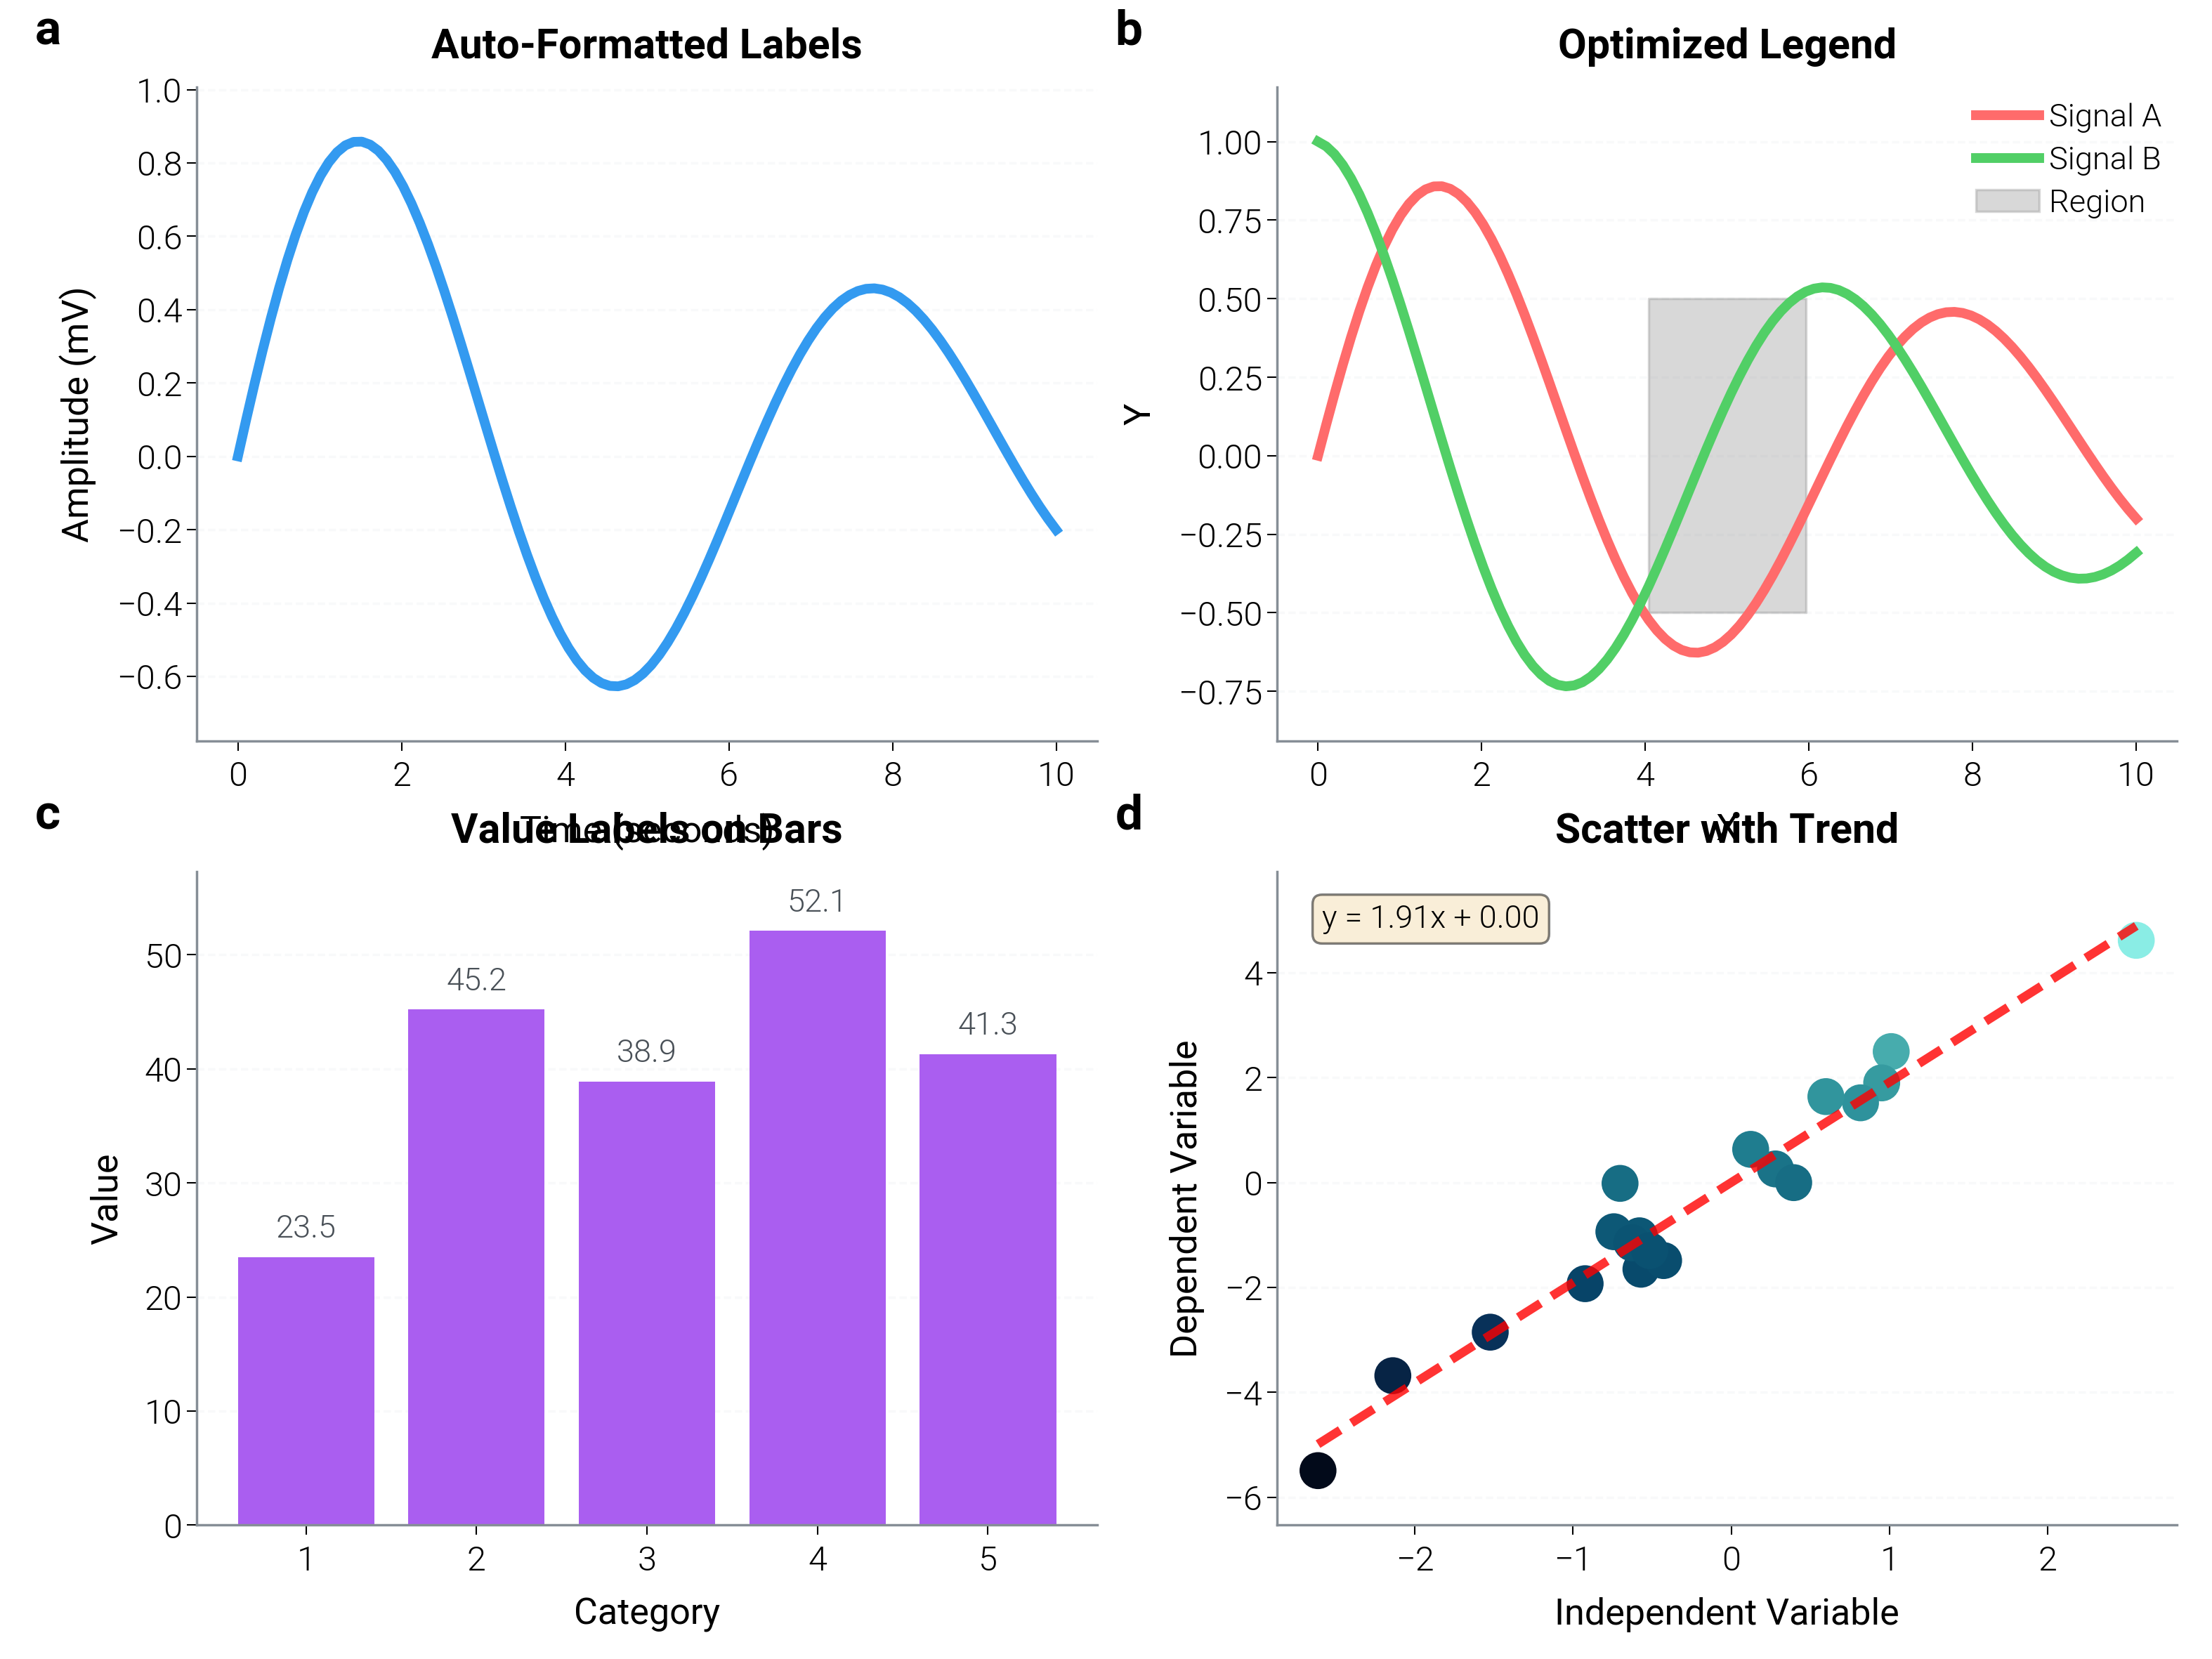
Formatting Helpers
Functions for consistent formatting across figures.
fig, axes = plt.subplots(2, 2, figsize=(dm.cm2in(16), dm.cm2in(12)))

# Generate sample data
x = np.linspace(0, 10, 100)
y1 = np.sin(x) * np.exp(-x / 10)
y2 = np.cos(x) * np.exp(-x / 10)

# Format axis labels with proper styling
ax1 = axes[0, 0]
ax1.plot(x, y1, color="oc.blue5", lw=dm.lw(1))
dm.helpers.formatting.format_axis_labels(
    ax1, x_label="Time", y_label="Amplitude", x_unit="seconds", y_unit="mV"
)
ax1.set_title("Auto-Formatted Labels", fontsize=dm.fs(1))
dm.minimal_axes(ax1)

# Optimize legend placement
ax2 = axes[0, 1]
ax2.plot(x, y1, color="oc.red5", label="Signal A", lw=dm.lw(1))
ax2.plot(x, y2, color="oc.green5", label="Signal B", lw=dm.lw(1))
ax2.fill_between(x[40:60], -0.5, 0.5, alpha=0.3, color="gray", label="Region")
dm.helpers.formatting.optimize_legend(
    ax2,
    preferred_loc="best",  # Automatically finds best position
)
ax2.set_title("Optimized Legend", fontsize=dm.fs(1))
ax2.set_xlabel("X", fontsize=dm.fs(0))
ax2.set_ylabel("Y", fontsize=dm.fs(0))
dm.minimal_axes(ax2)

# Add value labels to data points
ax3 = axes[1, 0]
x_points = np.array([1, 2, 3, 4, 5])
y_points = np.array([23.5, 45.2, 38.9, 52.1, 41.3])
ax3.bar(x_points, y_points, color="oc.purple5")
dm.helpers.formatting.add_value_labels(
    ax3, x_points, y_points, format_str=".1f", offset_y=0.02, fontsize=dm.fs(-1)
)
ax3.set_title("Value Labels on Bars", fontsize=dm.fs(1))
ax3.set_xlabel("Category", fontsize=dm.fs(0))
ax3.set_ylabel("Value", fontsize=dm.fs(0))
dm.minimal_axes(ax3)

# Combined formatting
ax4 = axes[1, 1]
x_scatter = np.random.randn(20)
y_scatter = 2 * x_scatter + np.random.randn(20) * 0.5
ax4.scatter(x_scatter, y_scatter, c=y_scatter, cmap="dc.deep_sea", s=50)
dm.helpers.formatting.format_axis_labels(
    ax4, x_label="Independent Variable", y_label="Dependent Variable"
)
# Add trend line
z = np.polyfit(x_scatter, y_scatter, 1)
p = np.poly1d(z)
x_trend = np.linspace(x_scatter.min(), x_scatter.max(), 100)
ax4.plot(x_trend, p(x_trend), "r--", alpha=0.8, lw=dm.lw(0.8))
ax4.text(
    0.05,
    0.95,
    f"y = {z[0]:.2f}x + {z[1]:.2f}",
    transform=ax4.transAxes,
    fontsize=dm.fs(-1),
    verticalalignment="top",
    bbox={"boxstyle": "round", "facecolor": "wheat", "alpha": 0.5},
)
ax4.set_title("Scatter with Trend", fontsize=dm.fs(1))
dm.minimal_axes(ax4)

dm.label_axes(axes.flat)
dm.simple_layout(fig)
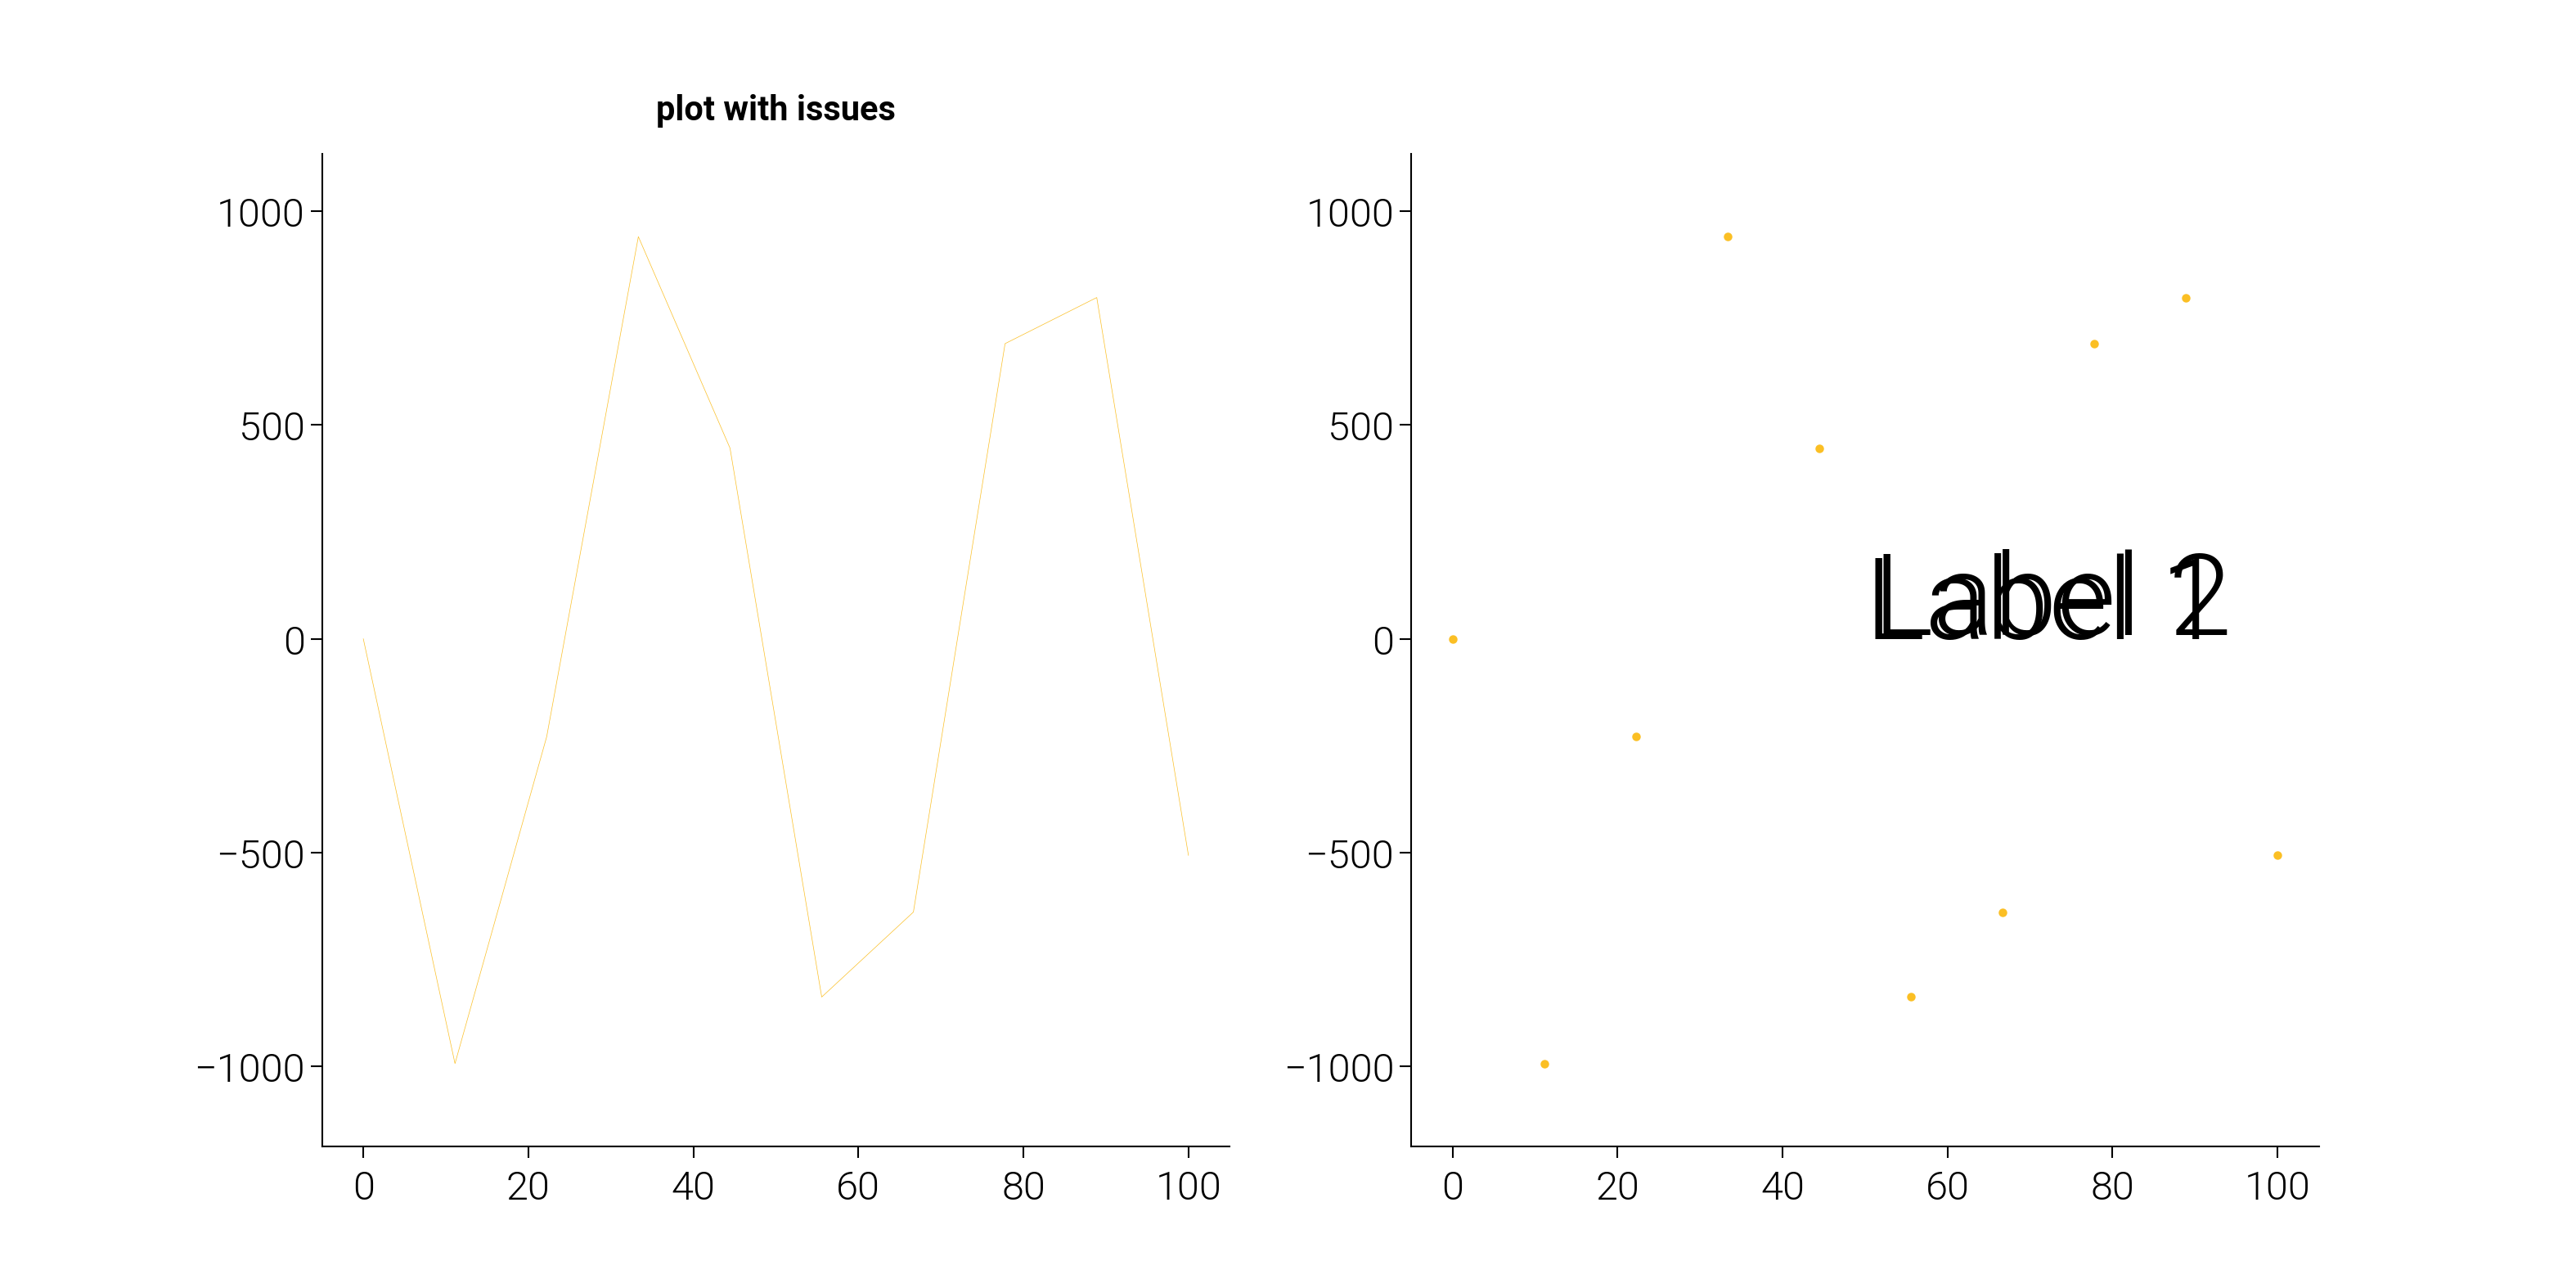
Quality Checks
Check figure quality and get suggestions for improvements.
# Create a figure with intentional issues
fig, (ax1, ax2) = plt.subplots(1, 2, figsize=(dm.cm2in(16), dm.cm2in(8)))

# Plot with potential issues
x = np.linspace(0, 100, 10)  # Too few points
y = np.sin(x) * 1000  # Very large values

ax1.plot(x, y, lw=0.1)  # Very thin line
ax1.set_title("plot with issues", fontsize=6)  # Small font
# Missing axis labels

ax2.scatter(x, y, s=1)  # Very small markers
# Overlapping text
ax2.text(50, 0, "Label 1", fontsize=20)
ax2.text(51, 10, "Label 2", fontsize=20)

# Check figure quality
print("Quality Check Results:")
print("=" * 50)
issues = dm.helpers.quality.check_figure_quality(fig)
if issues:
    for i, issue in enumerate(issues, 1):
        print(f"{i}. {issue}")
else:
    print("No quality issues detected!")

# Get chart type suggestion
print("\nChart Type Suggestions:")
print("=" * 50)

# Different data types
data_examples = [
    ("categorical", "continuous", 5, 1, "Categorical data"),
    ("temporal", "continuous", 100, 1, "Time series"),
    ("continuous", "continuous", 100, 1, "Correlation data"),
    ("categorical", None, 5, 1, "Single categorical"),
]

for x_type, y_type, n_points, n_series, description in data_examples:
    suggestion = dm.helpers.quality.suggest_chart_type(
        x_type=x_type, y_type=y_type, n_points=n_points, n_series=n_series
    )
    print(f"{description}: {suggestion}")
Quality Check Results:
==================================================
1. Axes 0: Missing x-axis label
2. Axes 0: Missing y-axis label
3. Axes 1: Missing x-axis label
4. Axes 1: Missing y-axis label

Chart Type Suggestions:
==================================================
Categorical data: bar
Time series: line
Correlation data: scatter_density
Single categorical: count_bar
I/O Utilities
Create and save figures with optimal settings.
# Create figure with pre-applied style
fig1 = dm.helpers.io.create_figure_with_style(
    style="scientific", figsize=(8, 6), dpi=100
)
ax1 = fig1.add_subplot(111)

# Plot data
x = np.linspace(0, 10, 100)
ax1.plot(x, np.sin(x), color="oc.blue5", lw=dm.lw(1.5), label="sin(x)")
ax1.plot(x, np.cos(x), color="oc.red5", lw=dm.lw(1.5), label="cos(x)")
ax1.set_xlabel("x", fontsize=dm.fs(0))
ax1.set_ylabel("y", fontsize=dm.fs(0))
ax1.set_title("Created with Style Helper", fontsize=dm.fs(2))
ax1.legend(fontsize=dm.fs(-1))
dm.minimal_axes(ax1)
dm.simple_layout(fig1)

# Save with optimal settings (commented out to avoid file creation)
# dm.helpers.io.save_figure(
#     fig1,
#     filename='output_optimized.png',
#     dpi=300,
#     transparent=False,
#     optimize=True  # Optimize file size
# )

print("\nFigure created with style helper")
print(f"Figure size: {fig1.get_size_inches()}")
print(f"DPI: {fig1.dpi}")
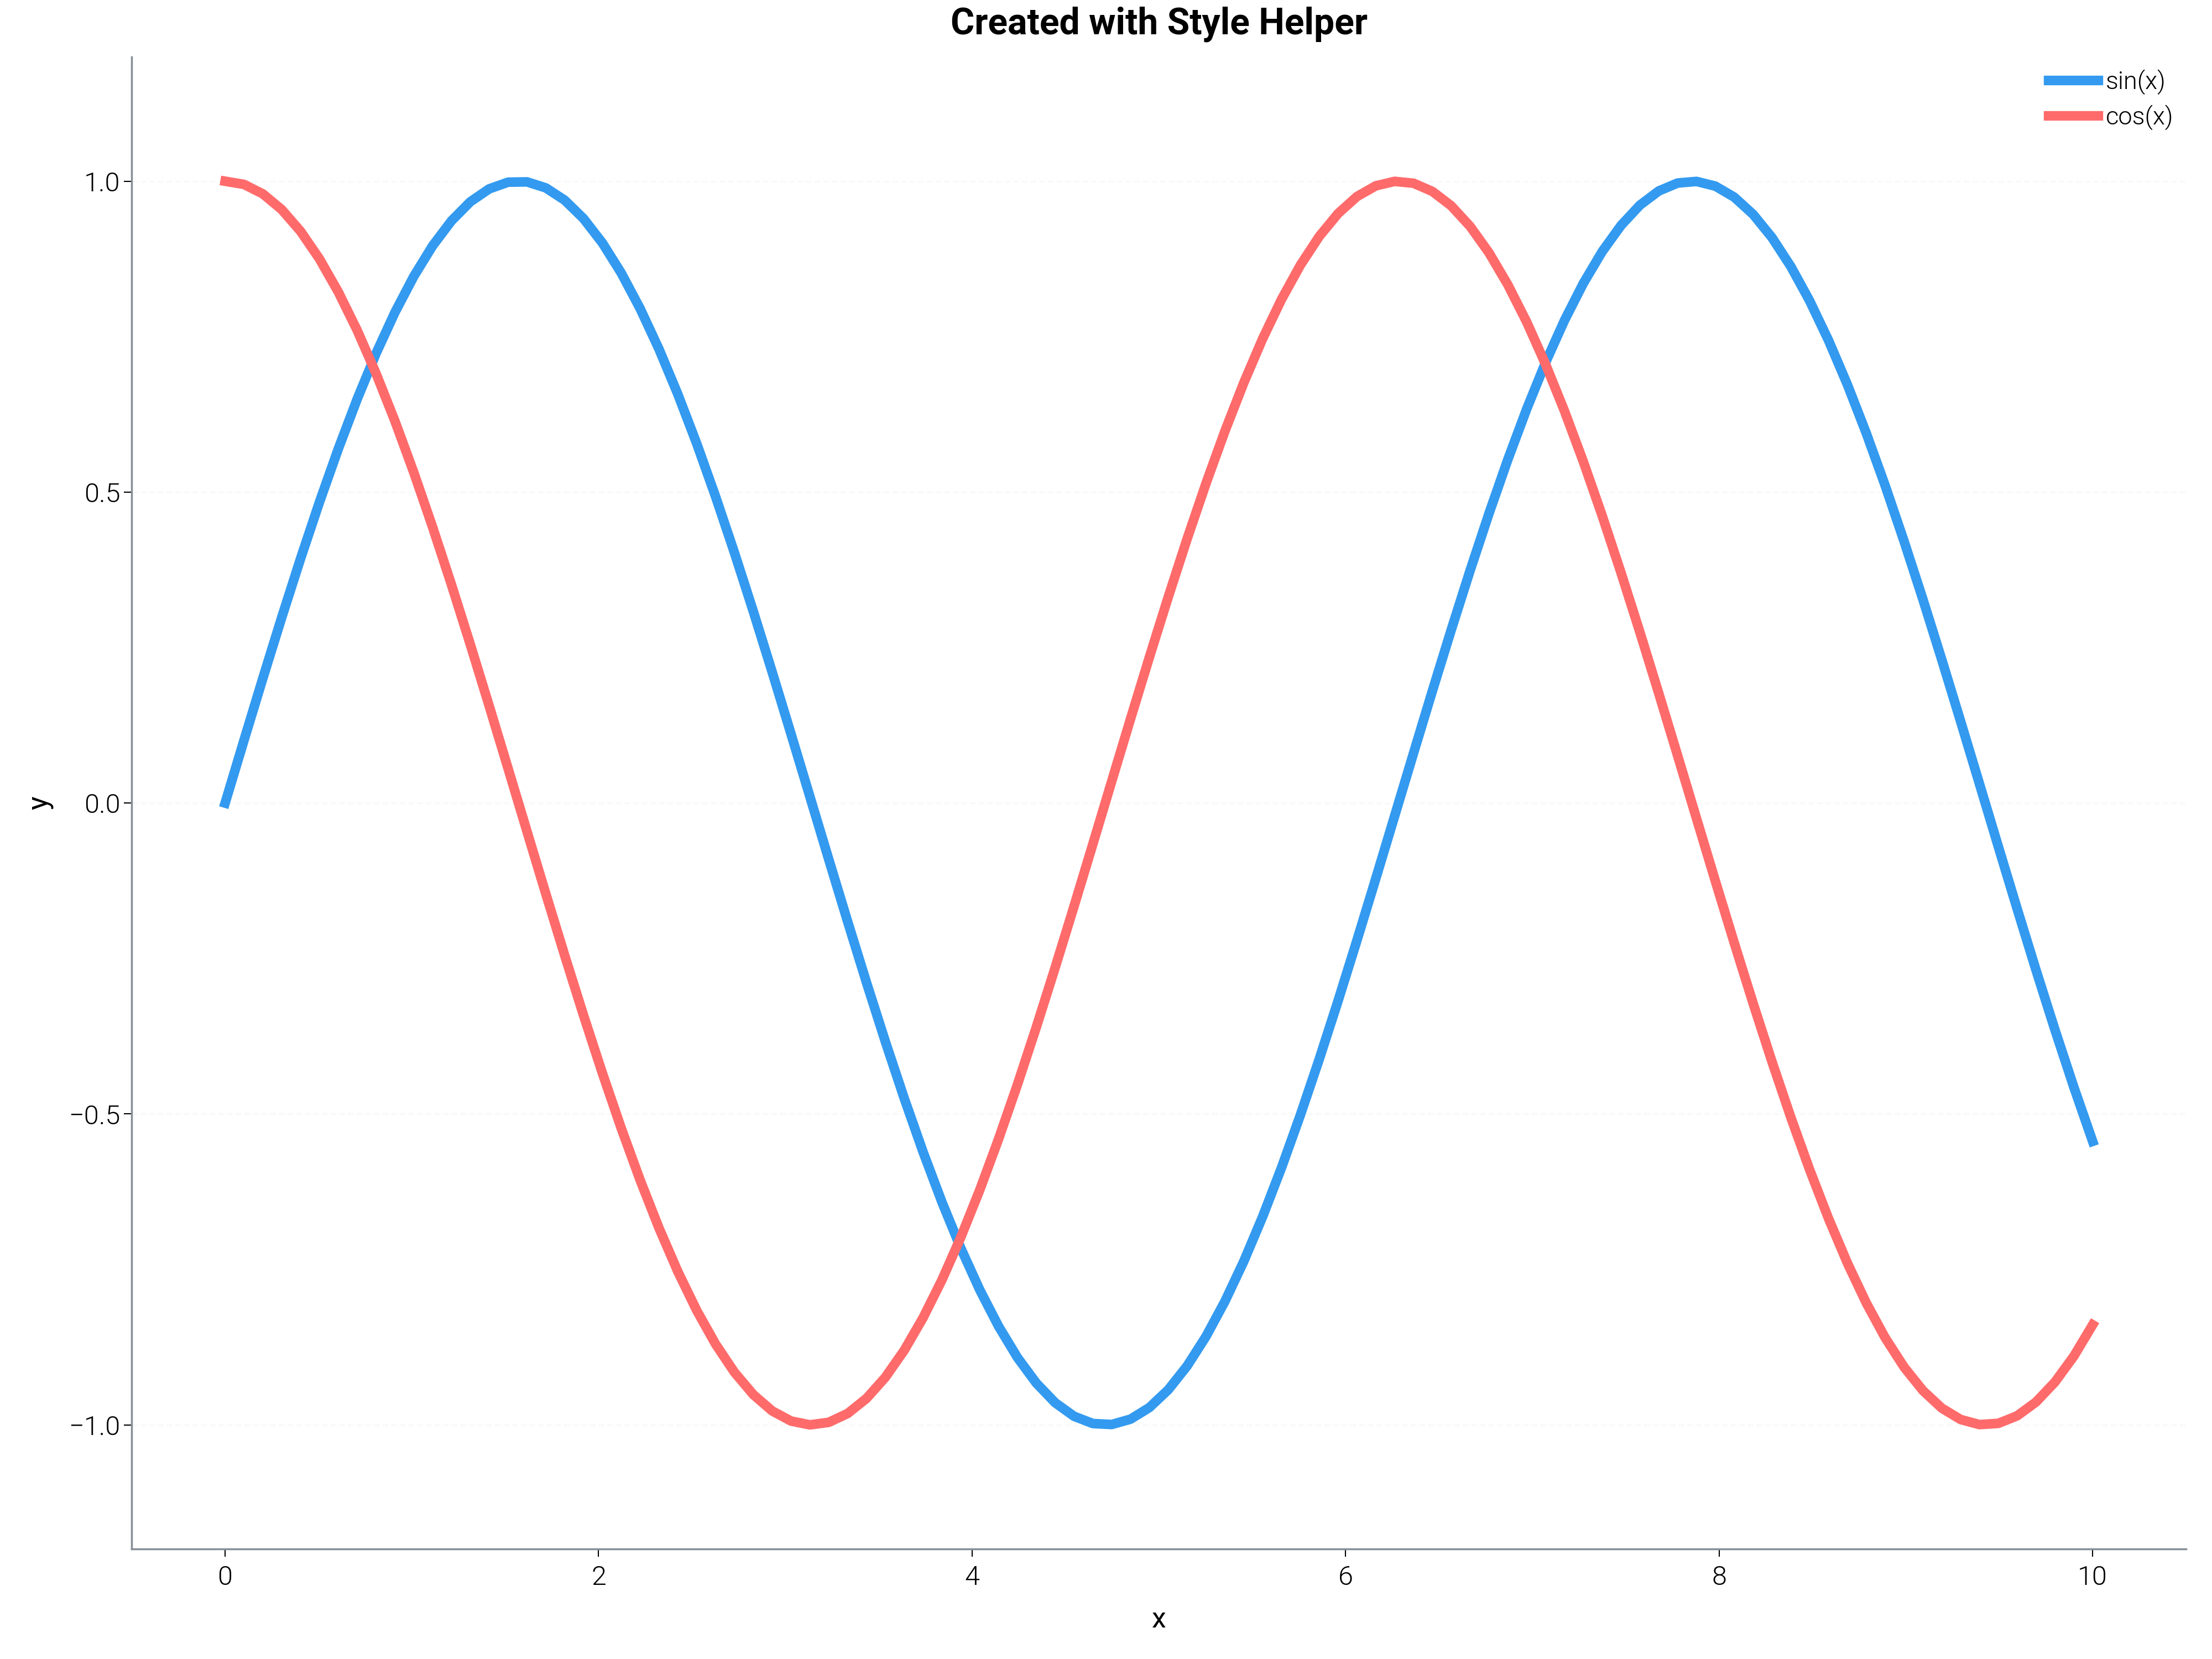
Figure created with style helper
Figure size: [8. 6.]
DPI: 100
Complete AI Workflow Example
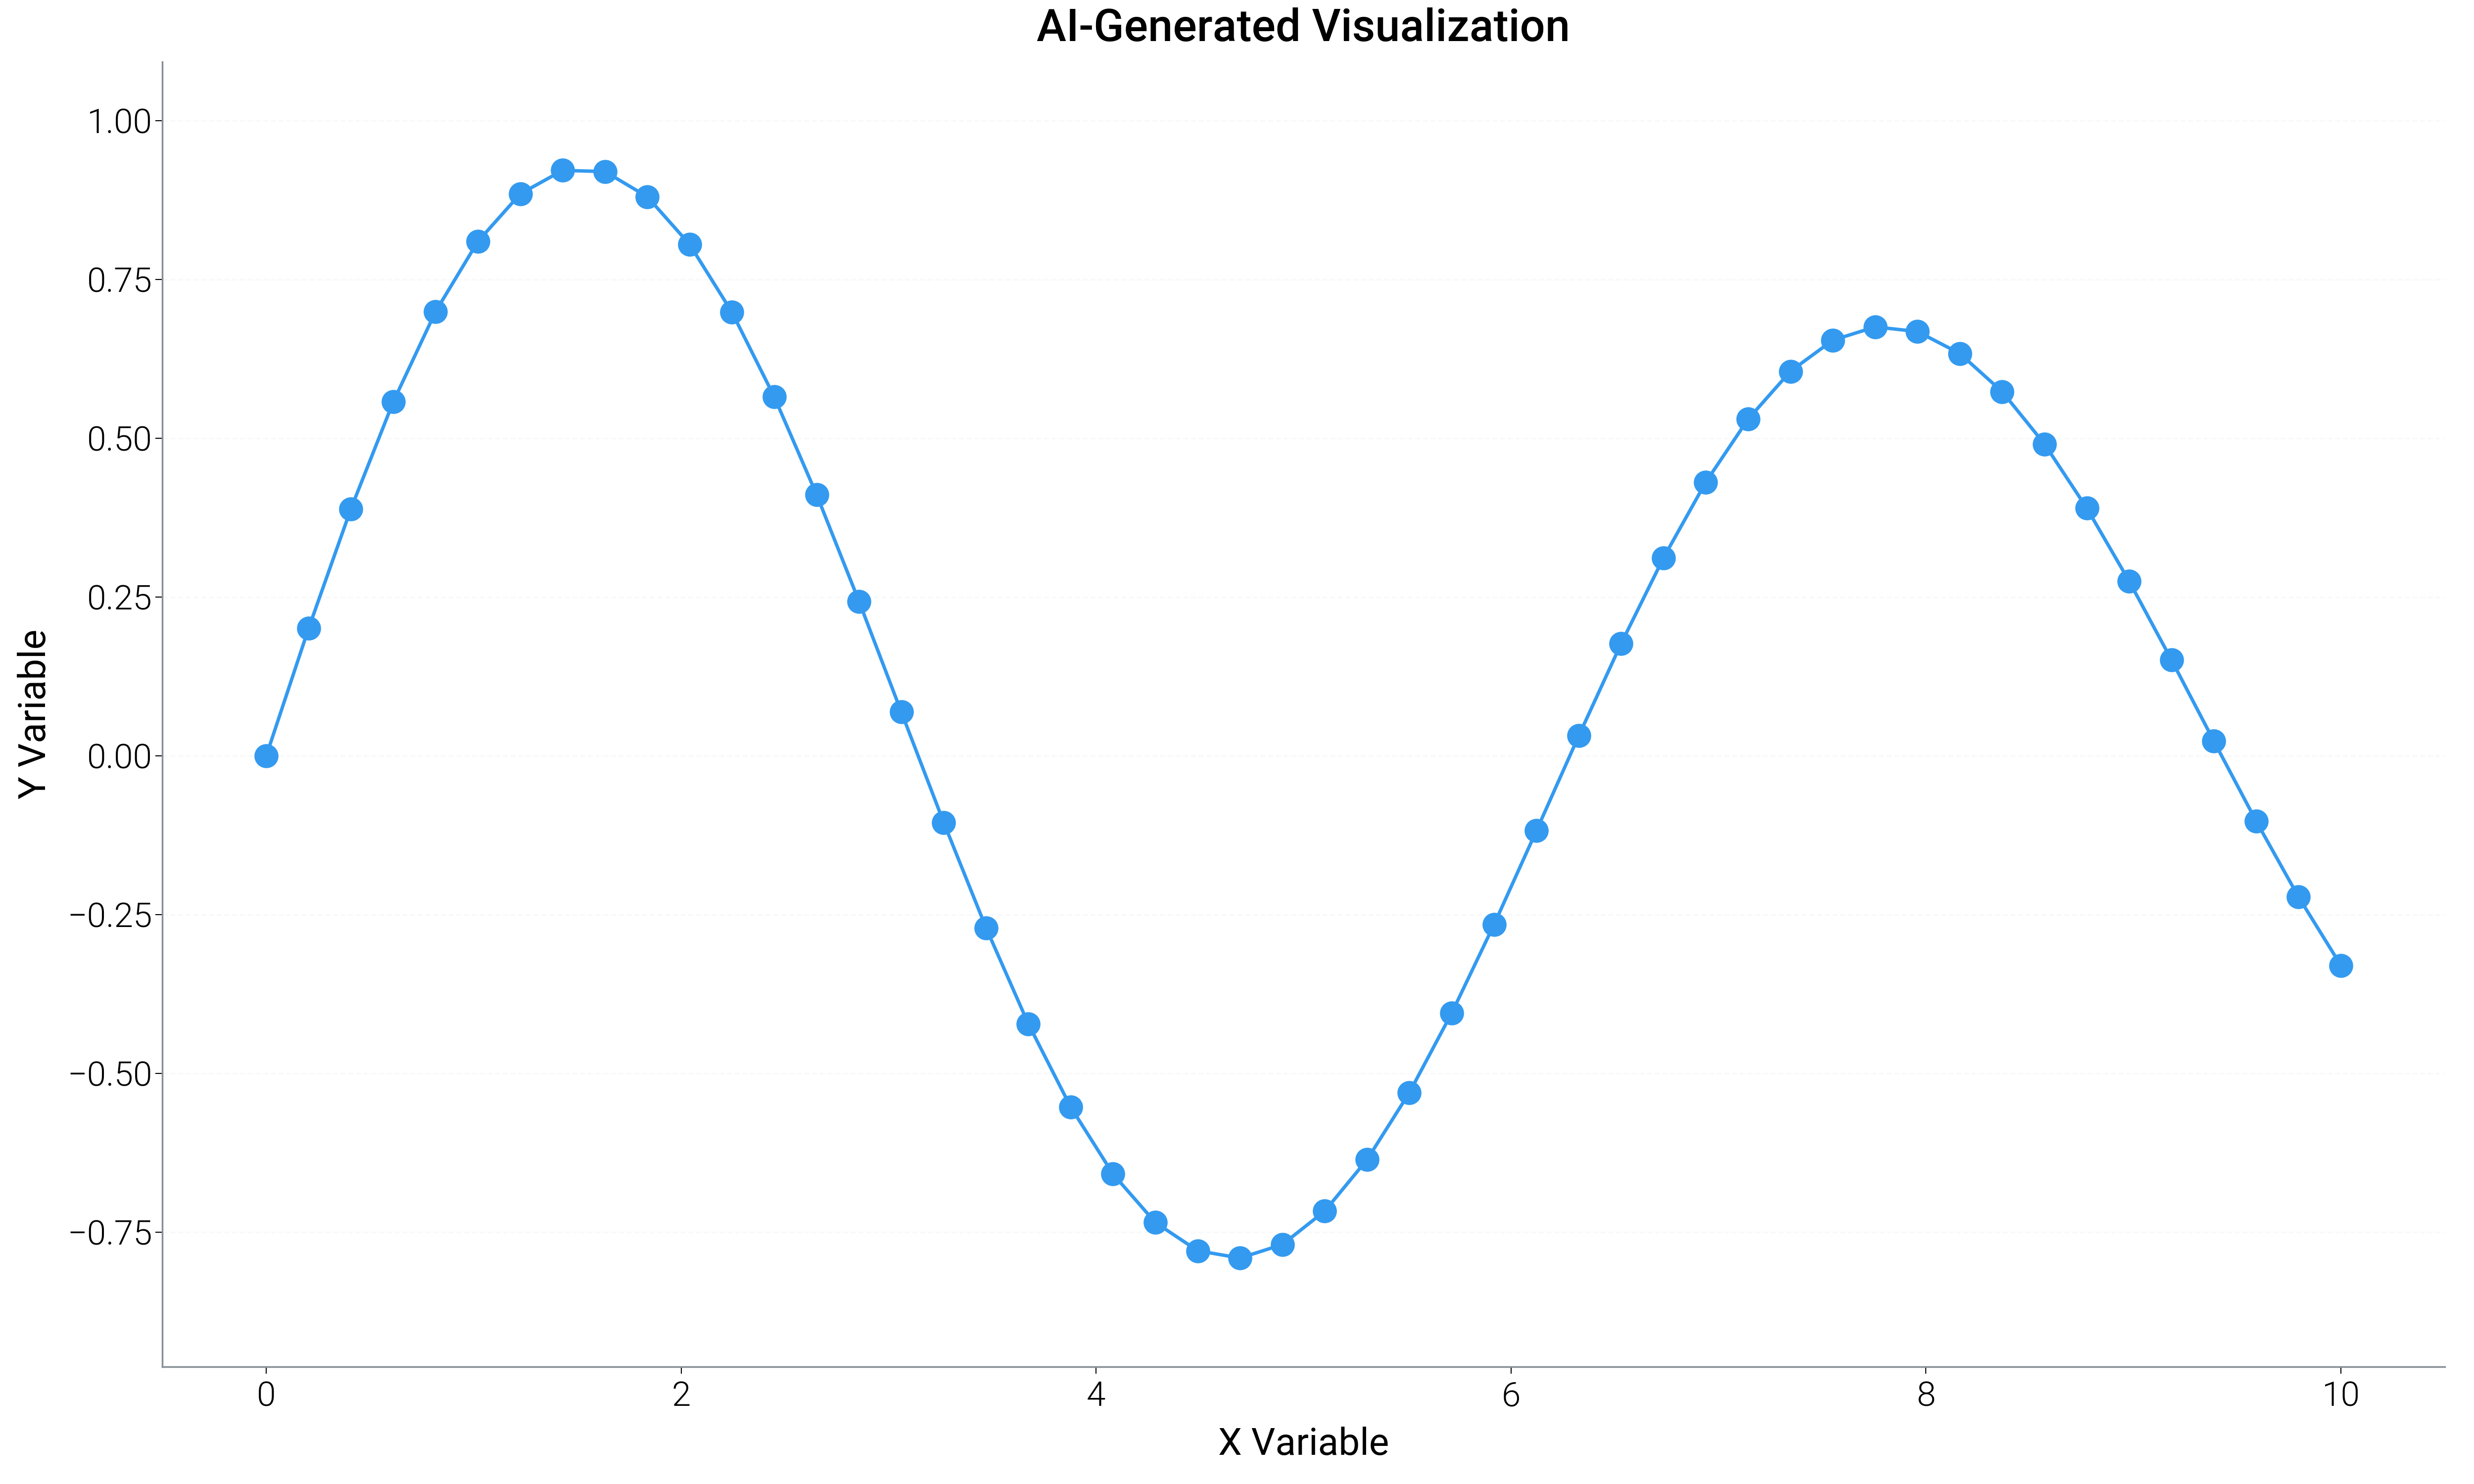
Example of how an AI agent might use these helpers together.
def ai_create_visualization(data_dict, chart_request="auto"):
    """
    Example function showing how an AI agent would use helpers.

    Parameters
    ----------
    data_dict : dict
        Dictionary with 'x' and 'y' data arrays
    chart_request : str
        Type of chart requested, or "auto" for suggestion
    """

    # Step 1: Validate input data
    print("Step 1: Validating data...")
    try:
        x, y = dm.helpers.data.validate_data(
            data_dict.get("x"),
            data_dict.get("y"),
            require_same_length=True,
            allow_nan=False,
            min_points=2,
        )
        print(f"✓ Data validated: {len(x)} points")
    except Exception as e:
        print(f"✗ Data validation failed: {e}")
        return None

    # Step 2: Determine chart type
    print("\nStep 2: Determining chart type...")
    if chart_request == "auto":
        chart_type = dm.helpers.quality.suggest_chart_type(
            x_type="continuous", y_type="continuous", n_points=len(x)
        )
        print(f"✓ Suggested chart type: {chart_type}")
    else:
        chart_type = chart_request
        print(f"✓ Using requested chart type: {chart_type}")

    # Step 3: Create figure with appropriate style
    print("\nStep 3: Creating figure...")
    style = "scientific" if chart_type in ["scatter", "line"] else "web"
    fig = dm.helpers.io.create_figure_with_style(style=style, figsize=(10, 6))
    ax = fig.add_subplot(111)
    print(f"✓ Figure created with style: {style}")

    # Step 4: Auto-select colors
    print("\nStep 4: Selecting colors...")
    if chart_type == "line":
        color_type = "sequential"
    elif chart_type == "bar":
        color_type = "categorical"
    else:
        color_type = "categorical"

    colors = dm.helpers.colors.auto_select_colors(
        n_series=1, color_type=color_type
    )
    print(f"✓ Colors selected: {color_type} palette")

    # Step 5: Create the plot
    print("\nStep 5: Creating plot...")
    if chart_type == "line":
        ax.plot(x, y, color=colors[0], lw=dm.lw(1.5))
    elif chart_type == "scatter":
        ax.scatter(x, y, color=colors[0], s=50, alpha=0.6)
    elif chart_type == "bar":
        ax.bar(x if x is not None else range(len(y)), y, color=colors[0])
    else:
        ax.plot(x, y, "o-", color=colors[0])
    print("✓ Plot created")

    # Step 6: Format and optimize
    print("\nStep 6: Formatting...")
    dm.helpers.formatting.format_axis_labels(
        ax,
        x_label="X Variable" if x is not None else "Index",
        y_label="Y Variable",
    )
    ax.set_title("AI-Generated Visualization", fontsize=dm.fs(2))
    dm.minimal_axes(ax)
    dm.simple_layout(fig)
    print("✓ Formatting applied")

    # Step 7: Check quality
    print("\nStep 7: Quality check...")
    issues = dm.helpers.quality.check_figure_quality(fig)
    if issues:
        print("⚠ Quality issues found:")
        for issue in issues:
            print(f"  - {issue}")
    else:
        print("✓ No quality issues detected")

    return fig, issues


# Test the AI workflow
print("=" * 60)
print("AI WORKFLOW DEMONSTRATION")
print("=" * 60)

# Create test data
test_data = {
    "x": np.linspace(0, 10, 50),
    "y": np.sin(np.linspace(0, 10, 50)) * np.exp(-np.linspace(0, 10, 50) / 20),
}

# Run the AI workflow
fig_ai, quality_issues = ai_create_visualization(
    test_data, chart_request="auto"
)

print("\n" + "=" * 60)
print("AI WORKFLOW COMPLETE")
print("=" * 60)

plt.show()
============================================================
AI WORKFLOW DEMONSTRATION
============================================================
Step 1: Validating data...
✓ Data validated: 50 points

Step 2: Determining chart type...
✓ Suggested chart type: scatter_density

Step 3: Creating figure...
✓ Figure created with style: web

Step 4: Selecting colors...
✓ Colors selected: categorical palette

Step 5: Creating plot...
✓ Plot created

Step 6: Formatting...
✓ Formatting applied

Step 7: Quality check...
✓ No quality issues detected

============================================================
AI WORKFLOW COMPLETE
============================================================
Total running time of the script: (0 minutes 17.255 seconds)