Note
Go to the end to download the full example code.
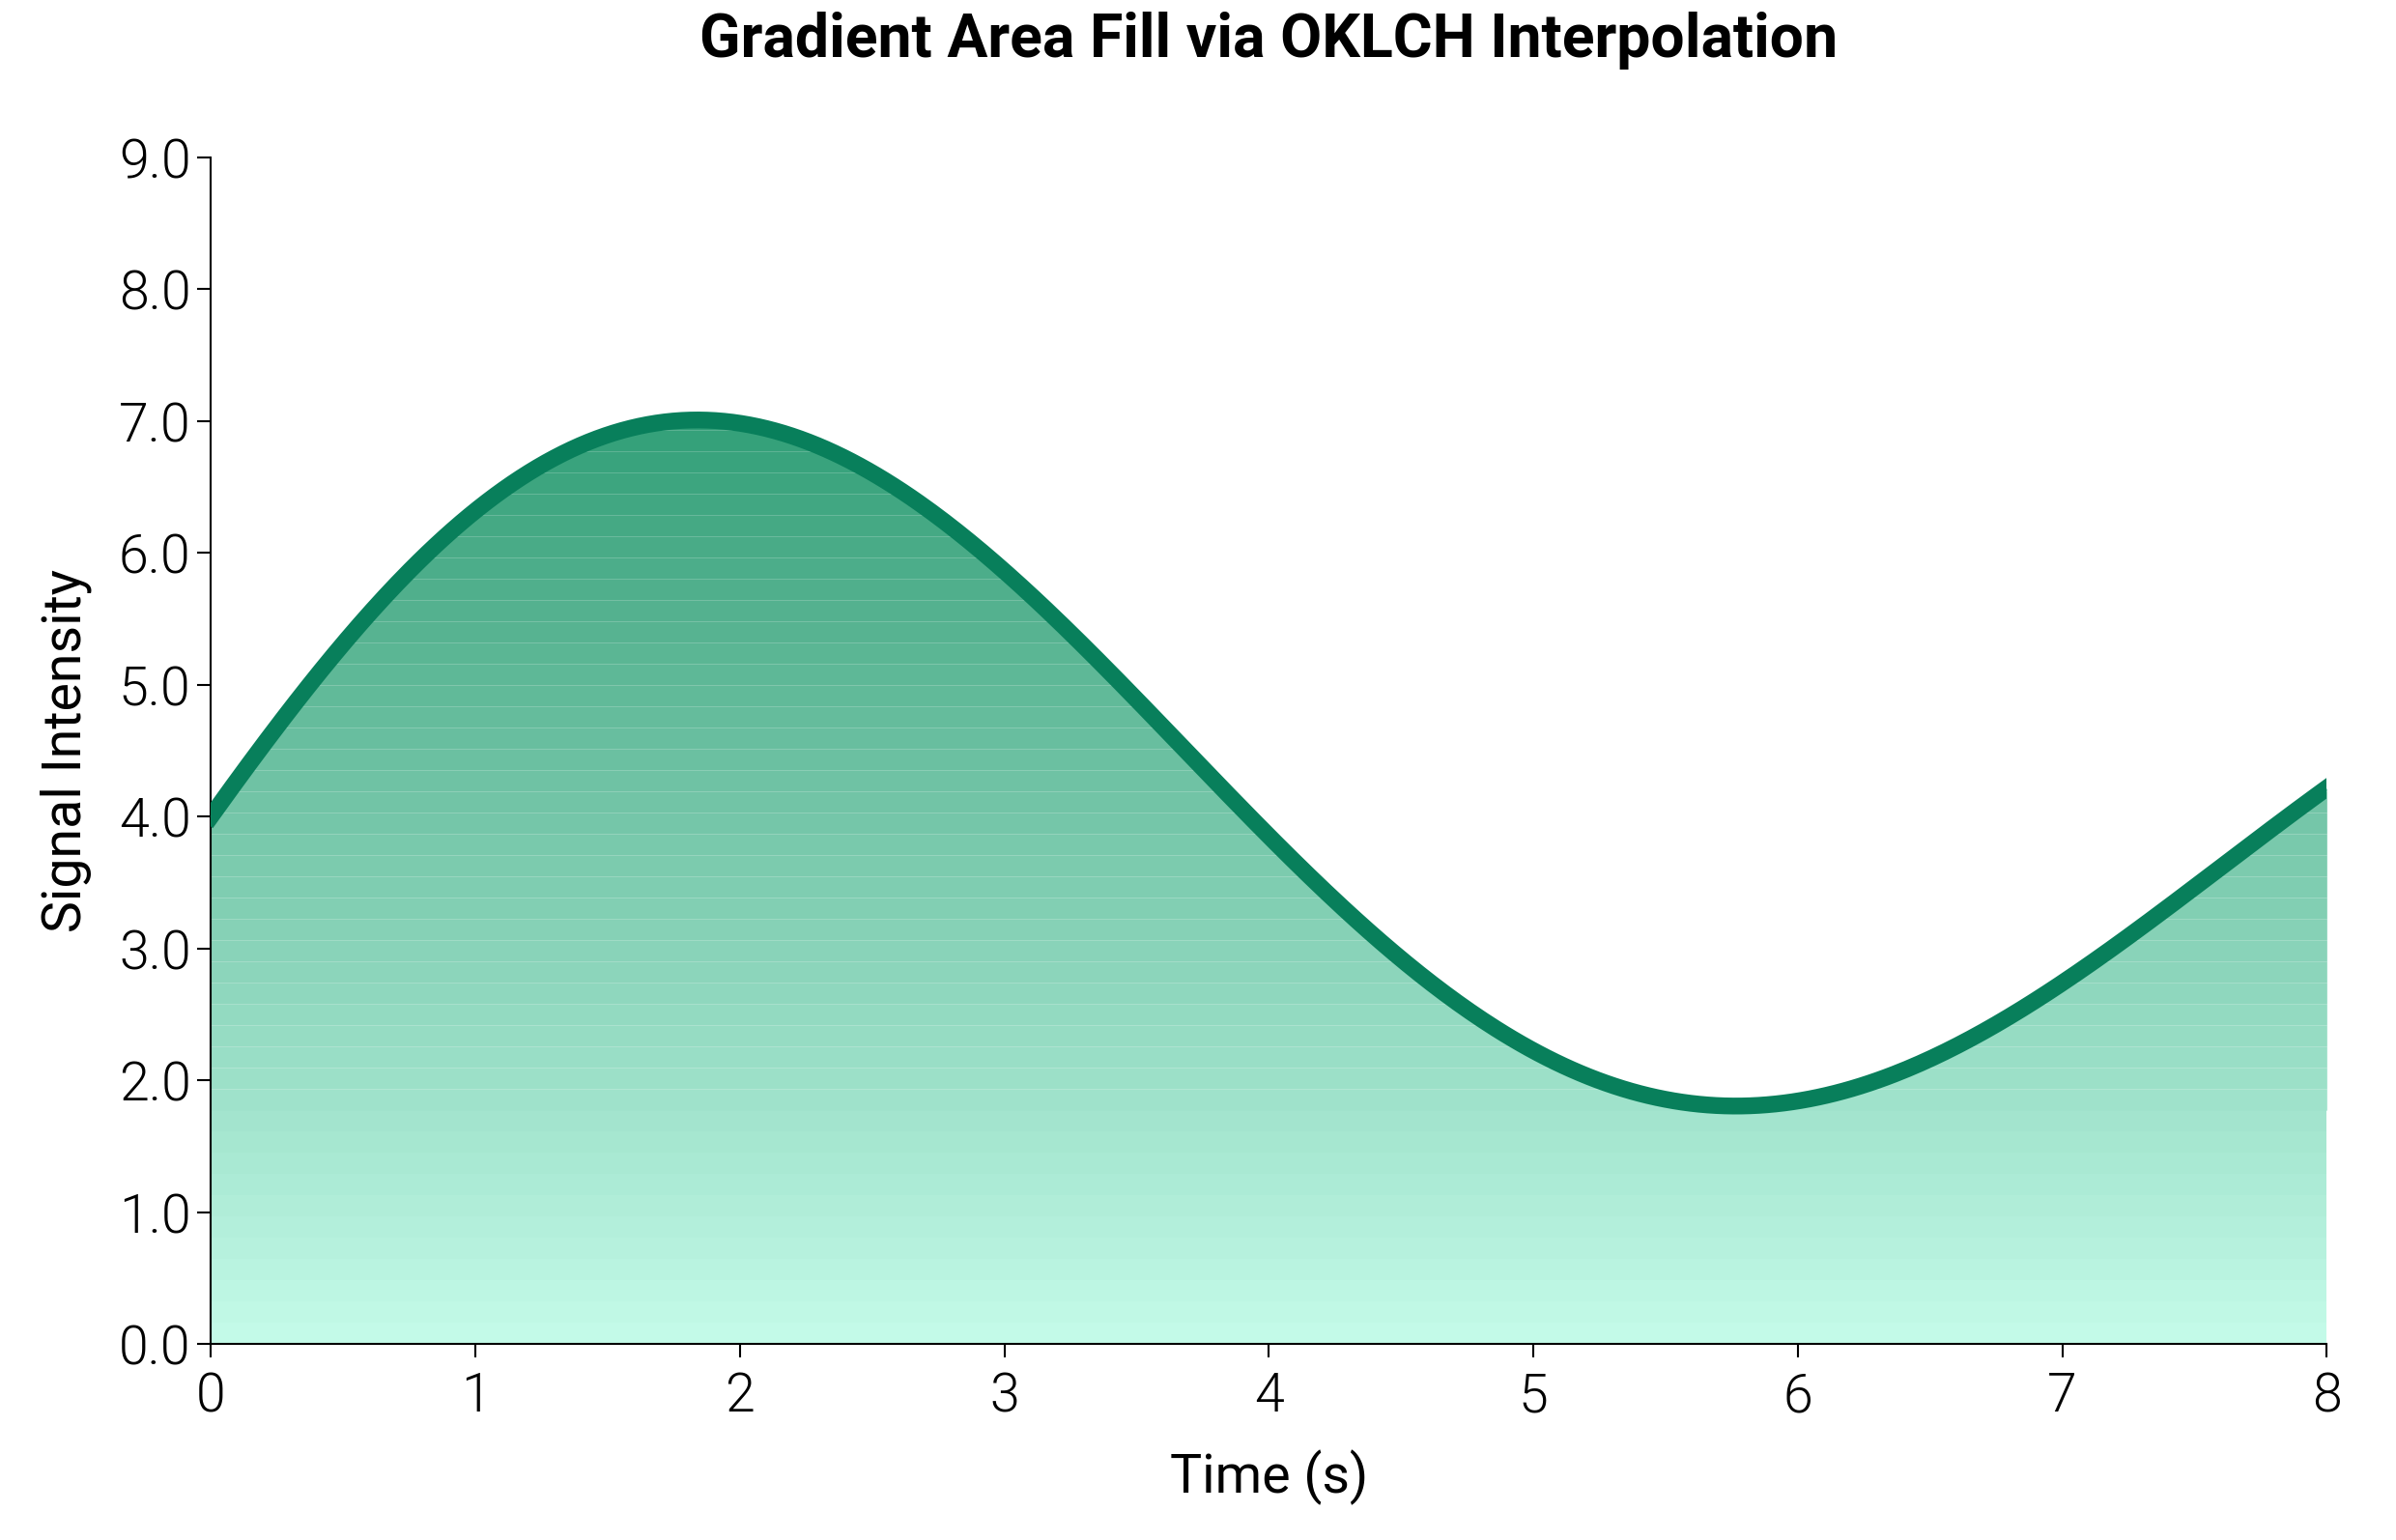
Gradient-Filled Area Chart via OKLCH
Standard fill_between only supports a single solid color per region.
By interpolating N colors through OKLCH with dm.cspace() and drawing
N thin horizontal bands, you get a smooth perceptual gradient fill
that remains vector-clean in SVG/PDF output.
import matplotlib.pyplot as plt
import numpy as np

import dartwork_mpl as dm

dm.style.use("report")

fig, ax = plt.subplots(figsize=(dm.SW * 1.4, dm.SW * 0.9))

# Signal data
x = np.linspace(0, 8, 500)
y = 3.5 * np.sin(x * 0.8) * np.exp(-0.08 * x) + 4

# Generate OKLCH gradient (teal-light → teal-dark, 50 steps)
n_bands = 50
gradient_colors = dm.cspace(
    dm.named("oc.teal1"), dm.named("oc.teal8"), n=n_bands, space="oklch"
)

# Draw horizontal bands as stacked fill_between slices
y_min, y_max = 0, y.max() * 1.15
band_edges = np.linspace(y_min, y_max, n_bands + 1)

for i in range(n_bands):
    y_lo = band_edges[i]
    y_hi = band_edges[i + 1]
    # Clip the signal: only fill where signal is above this band
    clipped = np.clip(y, y_lo, y_hi)
    ax.fill_between(
        x, y_lo, clipped, color=gradient_colors[i].to_hex(), alpha=1.0, lw=0
    )

# Signal outline on top
ax.plot(x, y, color="oc.teal9", lw=dm.lw(1.5), zorder=5)

ax.set_xlim(0, 8)
ax.set_ylim(0, y_max)
ax.set_title(
    "Gradient Area Fill via OKLCH Interpolation",
    fontsize=dm.fs(1),
    weight="bold",
    pad=15,
)
ax.set_xlabel("Time (s)")
ax.set_ylabel("Signal Intensity")

dm.set_decimal(ax, yn=1)
dm.simple_layout(fig)
plt.show()
Total running time of the script: (0 minutes 1.430 seconds)