Note
Go to the end to download the full example code.
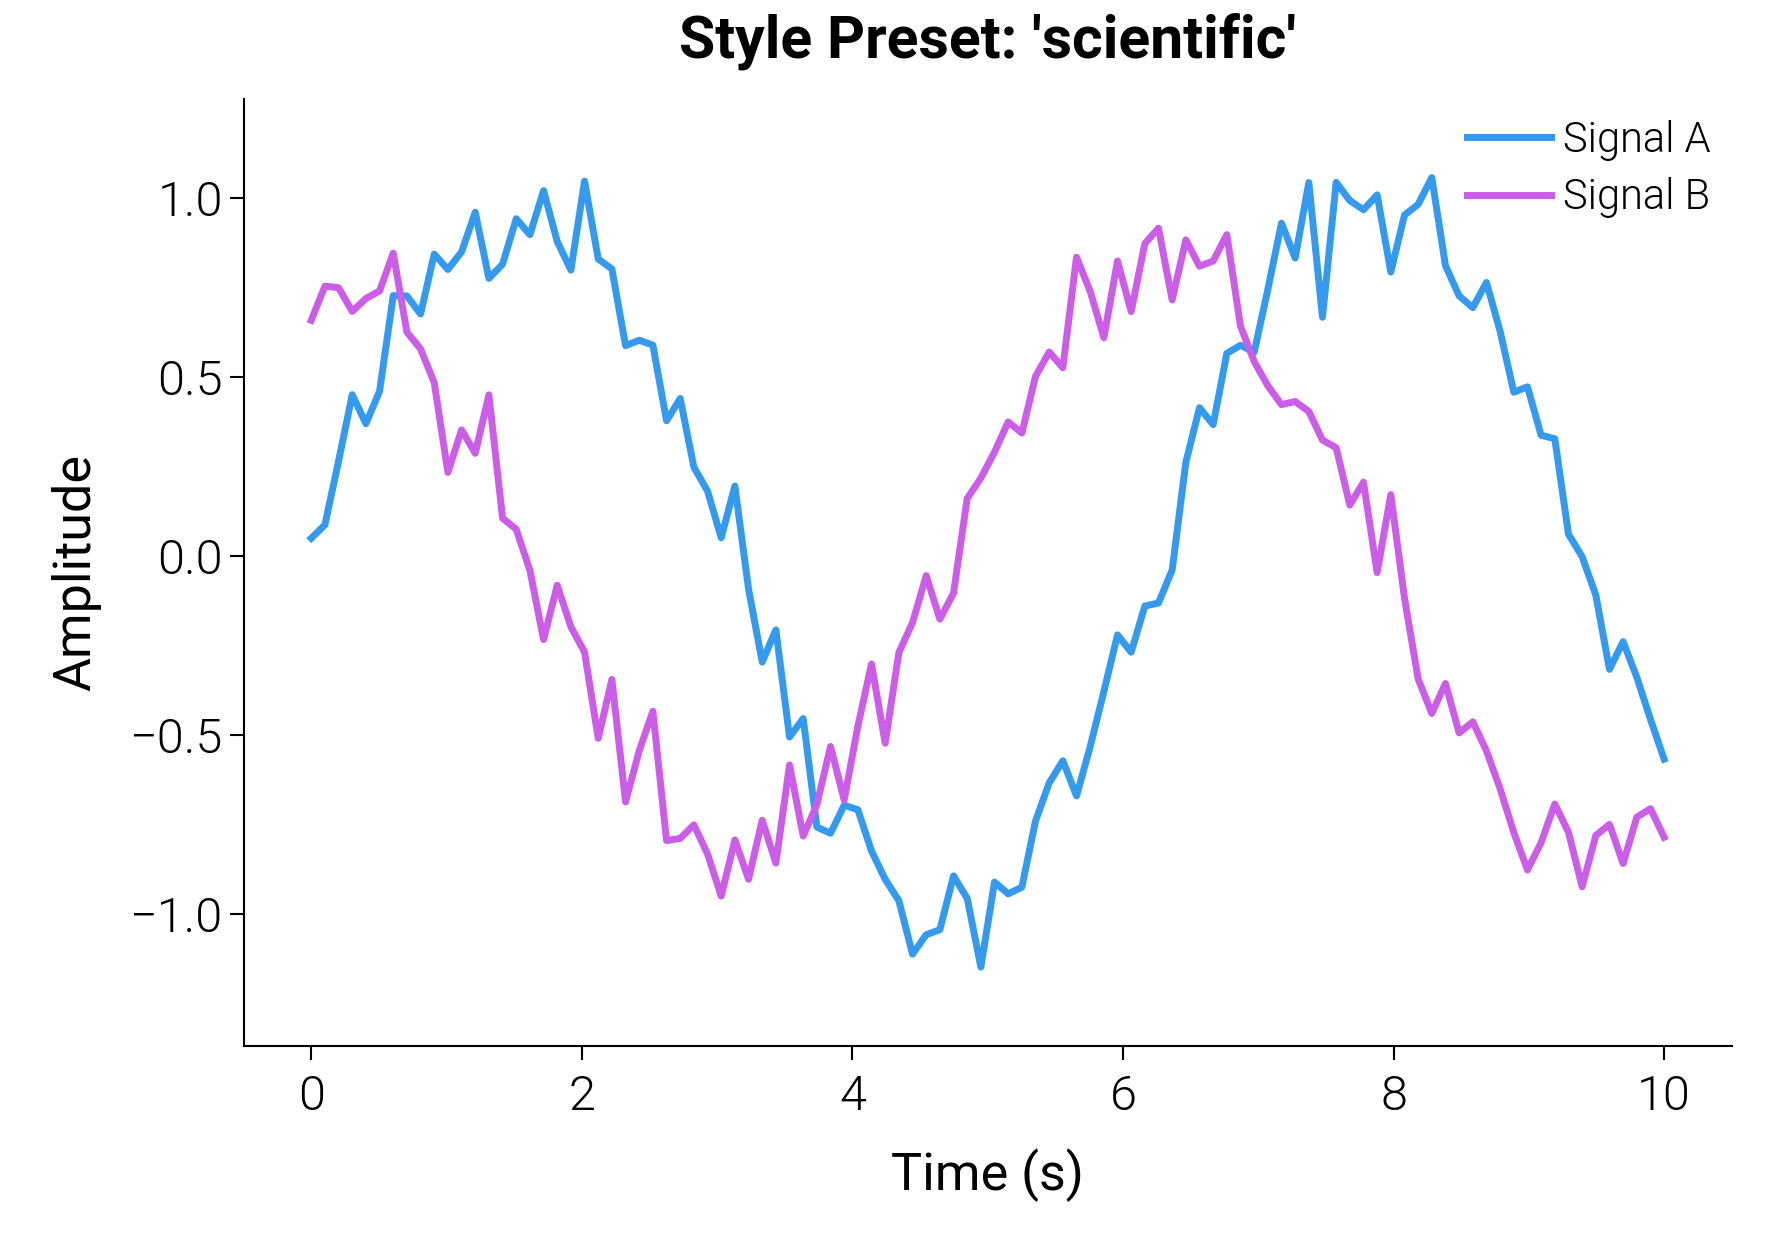
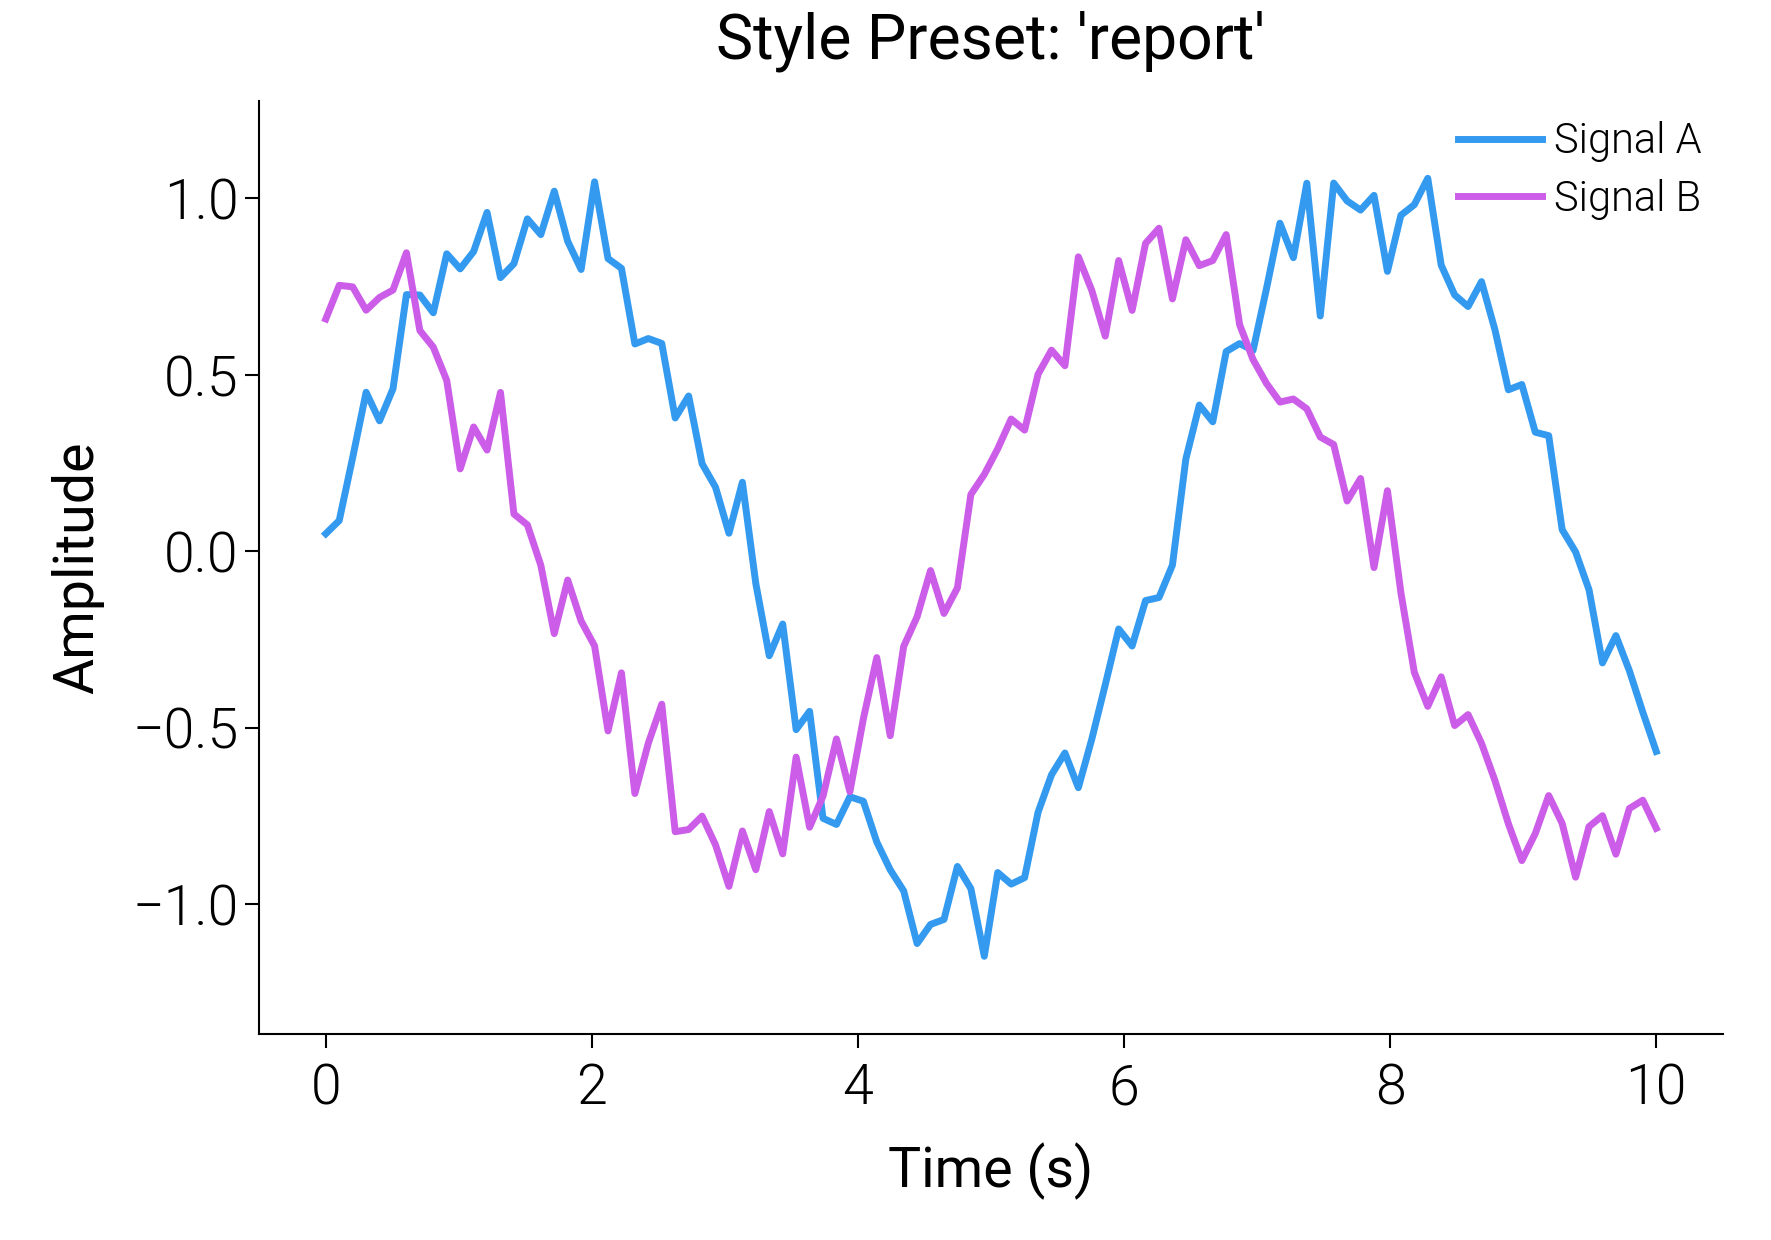
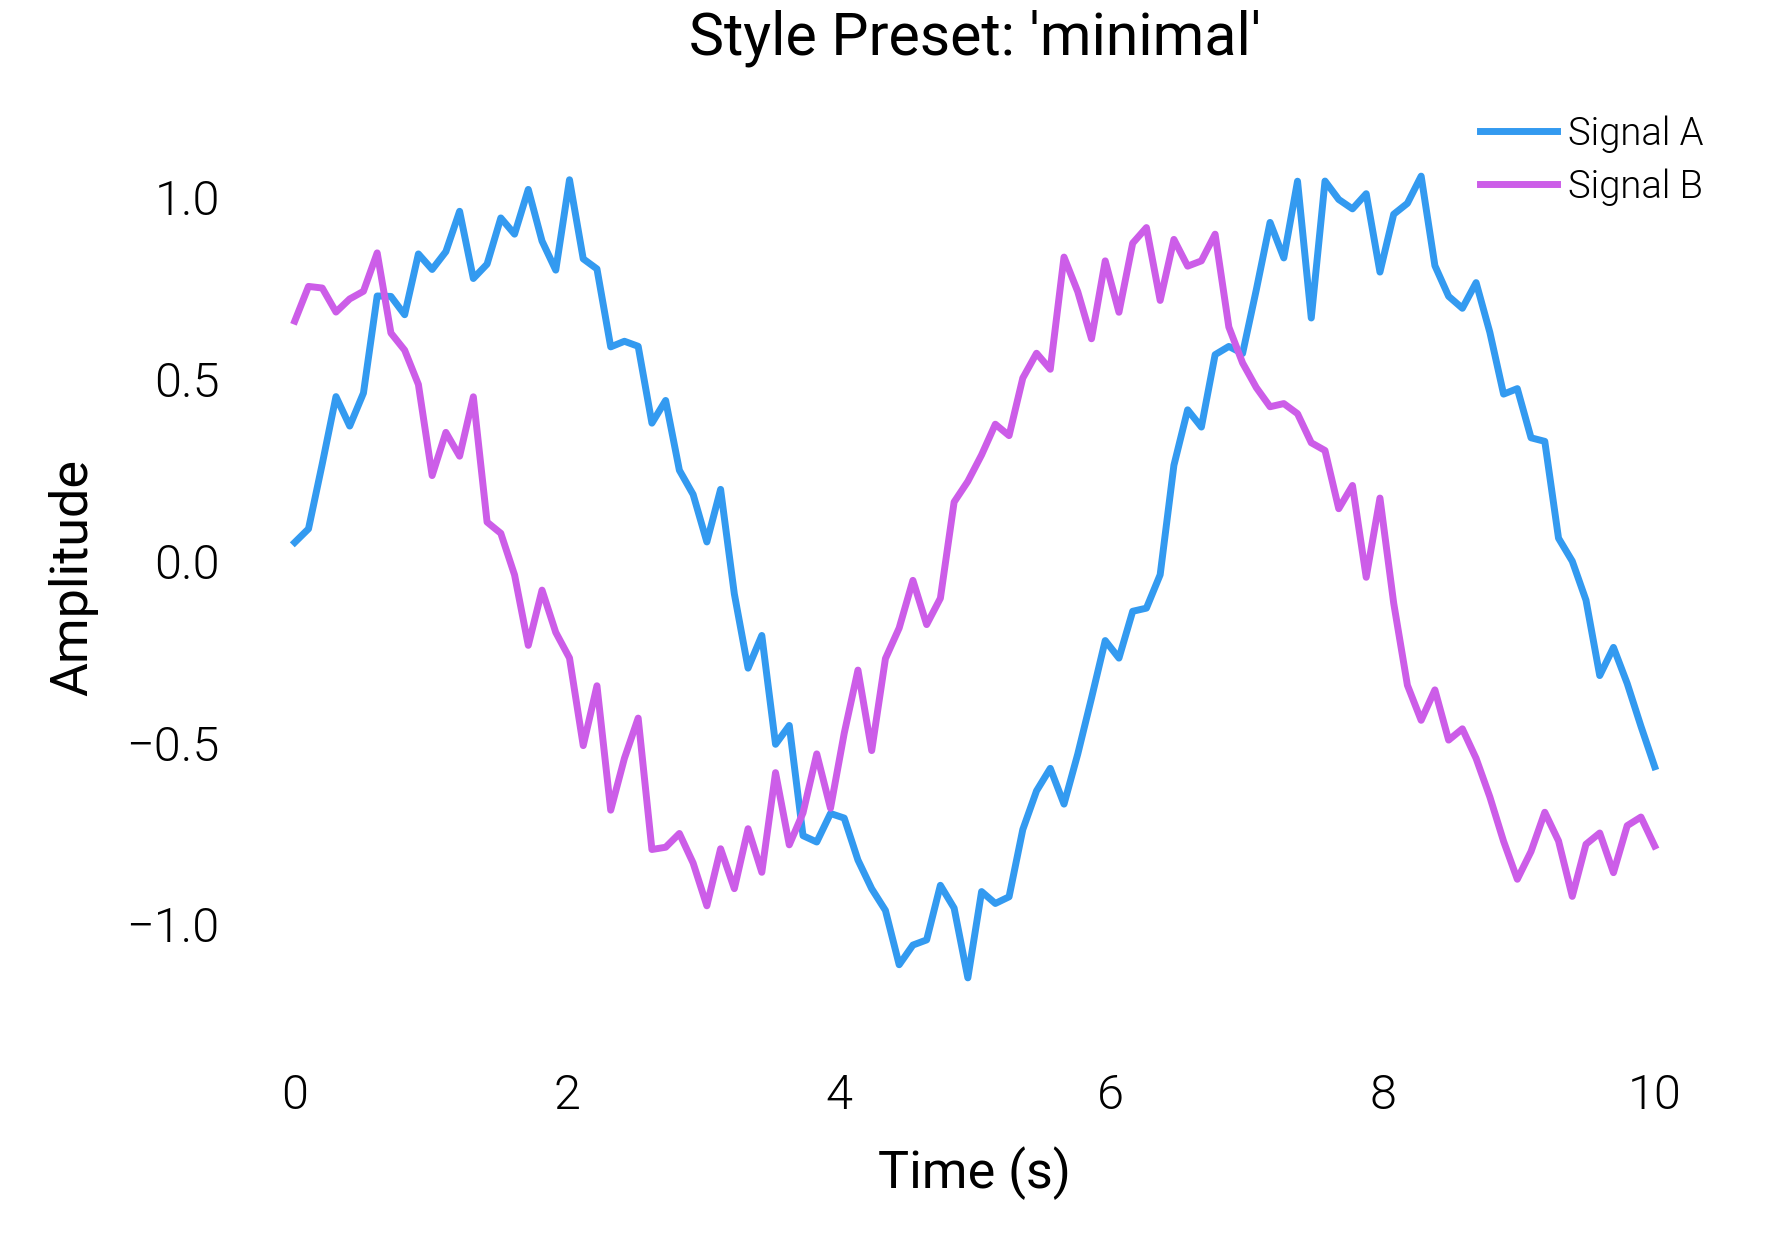
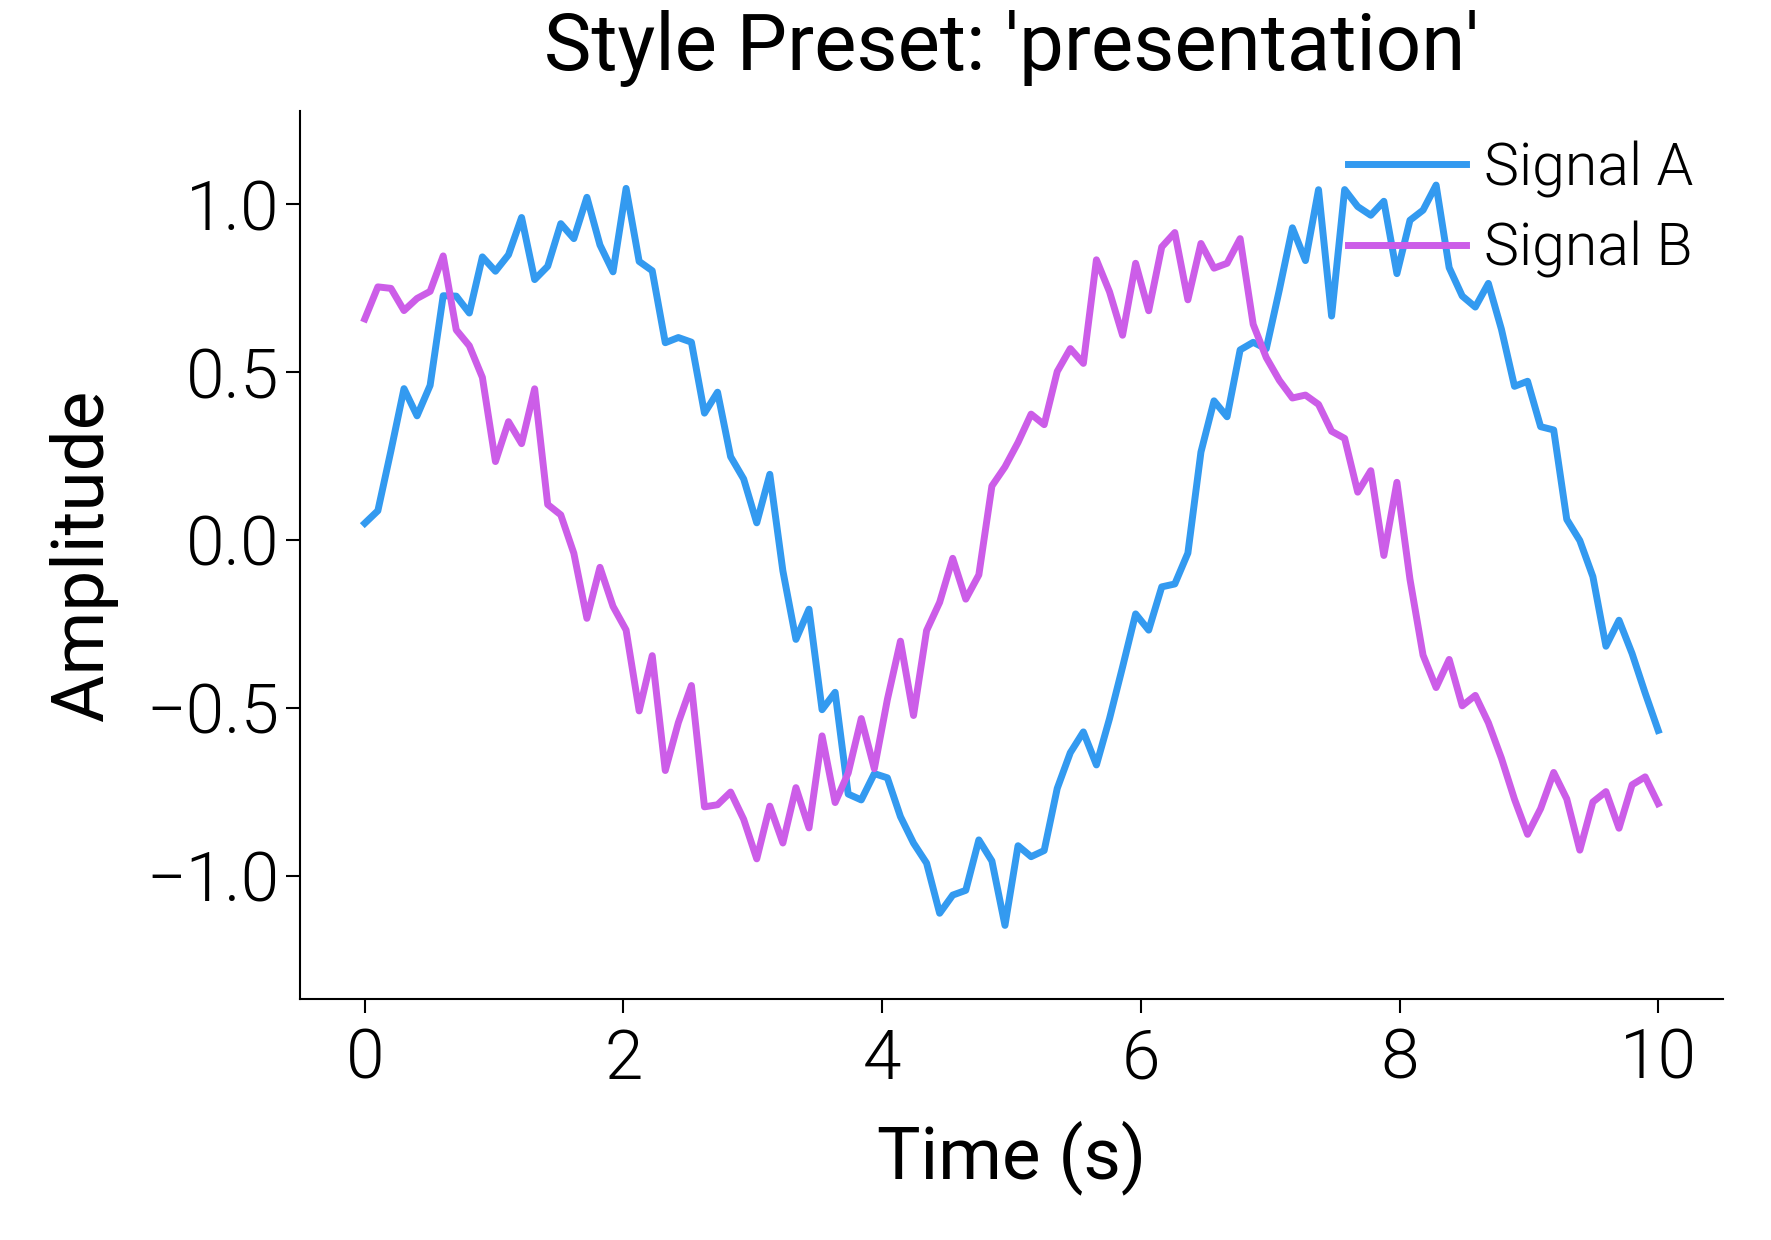
Style Presets Comparison
dartwork-mpl ships with carefully crafted style presets for different contexts.
Rather than just changing colors or fonts, these presets dynamically and proportionally
scale fonts, line widths, and spacing through the dm.fs(), dm.lw() helpers.
This example generates the same dataset under four different presets:
scientific, report, minimal, and presentation.
import matplotlib.pyplot as plt
import numpy as np

import dartwork_mpl as dm

# Sample data
np.random.seed(42)
x = np.linspace(0, 10, 100)
y1 = np.sin(x) + np.random.normal(0, 0.1, 100)
y2 = np.cos(x) * 0.8 + np.random.normal(0, 0.1, 100)

presets = ["scientific", "report", "minimal", "presentation"]

for preset in presets:
    dm.style.use(preset)
    fig, ax = plt.subplots(figsize=(dm.SW, dm.SW * 0.7))

    ax.plot(x, y1, label="Signal A", color="oc.blue5", lw=dm.lw(0))
    ax.plot(x, y2, label="Signal B", color="oc.grape5", lw=dm.lw(0))

    ax.set_title(f"Style Preset: '{preset}'")
    ax.set_xlabel("Time (s)")
    ax.set_ylabel("Amplitude")
    ax.legend(loc="upper right")

    dm.simple_layout(fig)
plt.show()
Total running time of the script: (0 minutes 3.869 seconds)