Note
Go to the end to download the full example code.
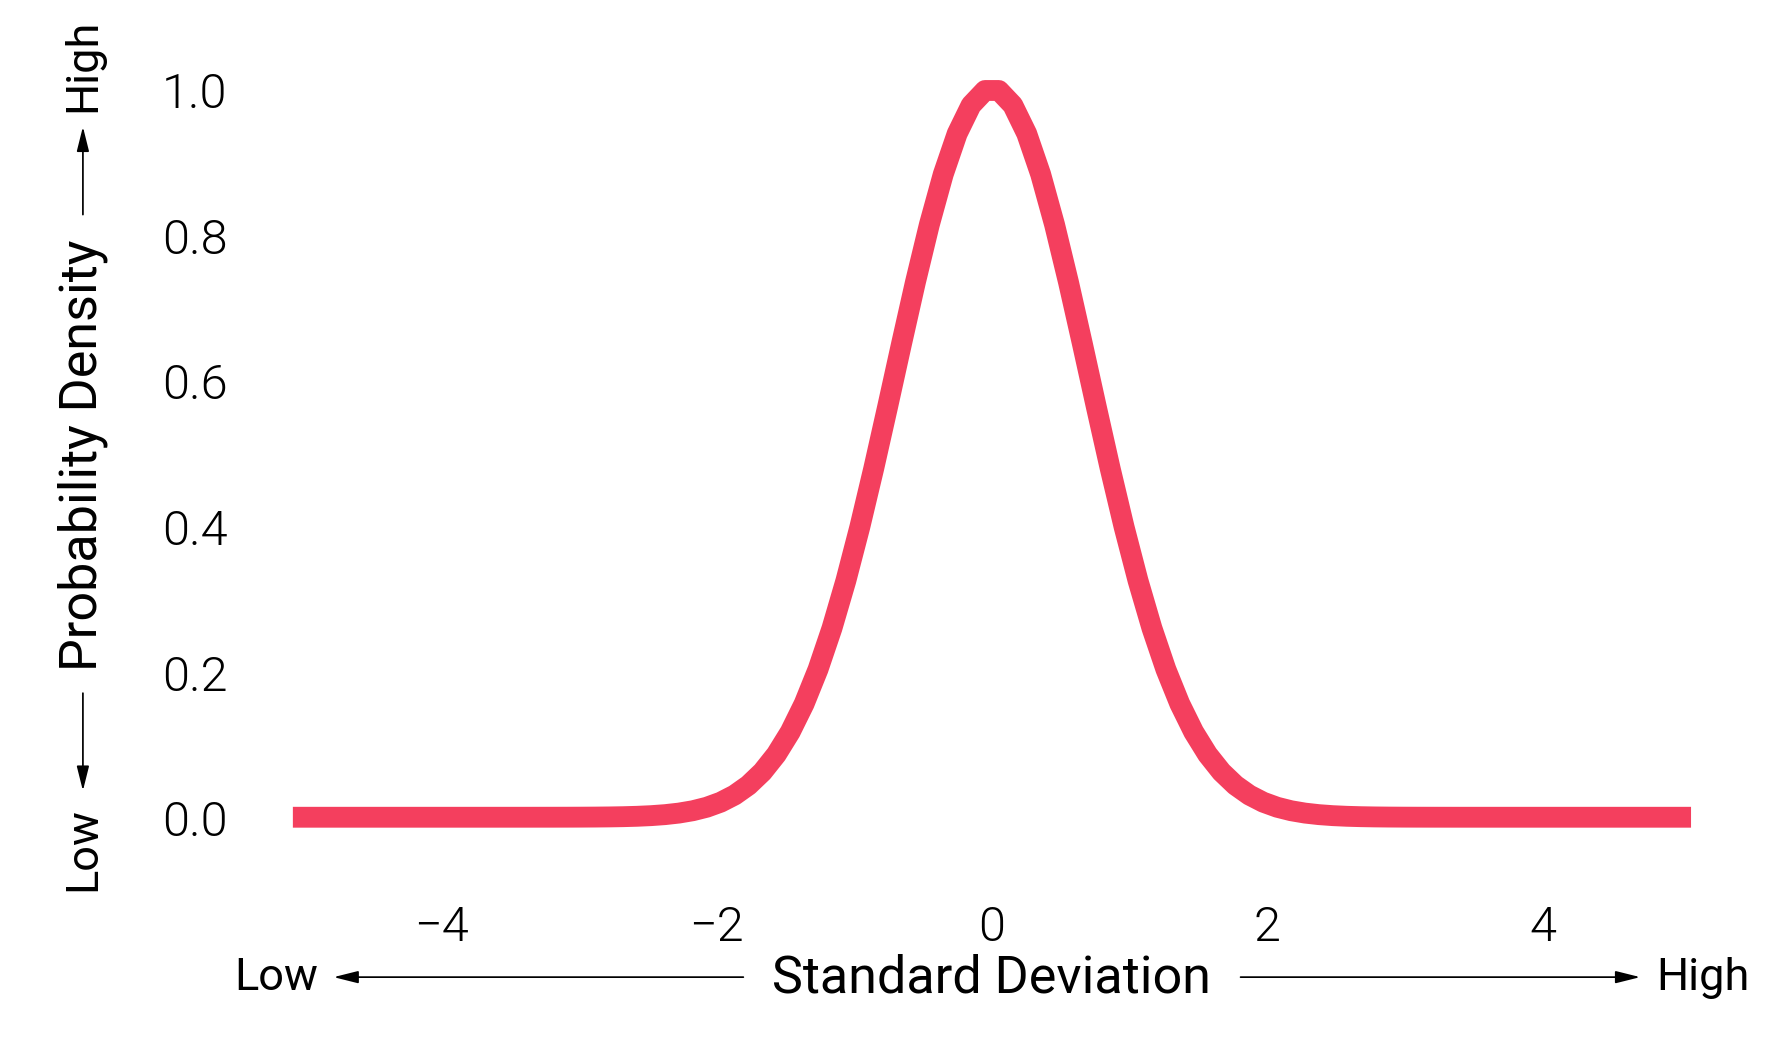
Directional Axes & Tick Formatting
Clean up standard matplotlib axes with exact decimal control via dm.set_decimal()
and directional arrows via dm.arrow_axis() for conceptual or data-ink optimized plots.
import matplotlib.pyplot as plt
import numpy as np

import dartwork_mpl as dm

dm.style.use("minimal")

fig, ax = plt.subplots(figsize=(dm.SW, dm.SW * 0.6))

x = np.linspace(-5, 5, 100)
y = np.exp(-(x**2))

ax.plot(x, y, color="tw.rose500", lw=dm.lw(2))

# Convert traditional axes to semantic directional arrows
# Note: Default offset has been improved to -0.10 to avoid overlap
dm.arrow_axis(ax, "x", "Standard Deviation")
dm.arrow_axis(ax, "y", "Probability Density")

# Use simple_layout with sufficient margins for arrow axes
dm.simple_layout(fig, margins=(0.12, 0.08, 0.12, 0.08))
plt.show()
Total running time of the script: (0 minutes 0.988 seconds)