Note
Go to the end to download the full example code.
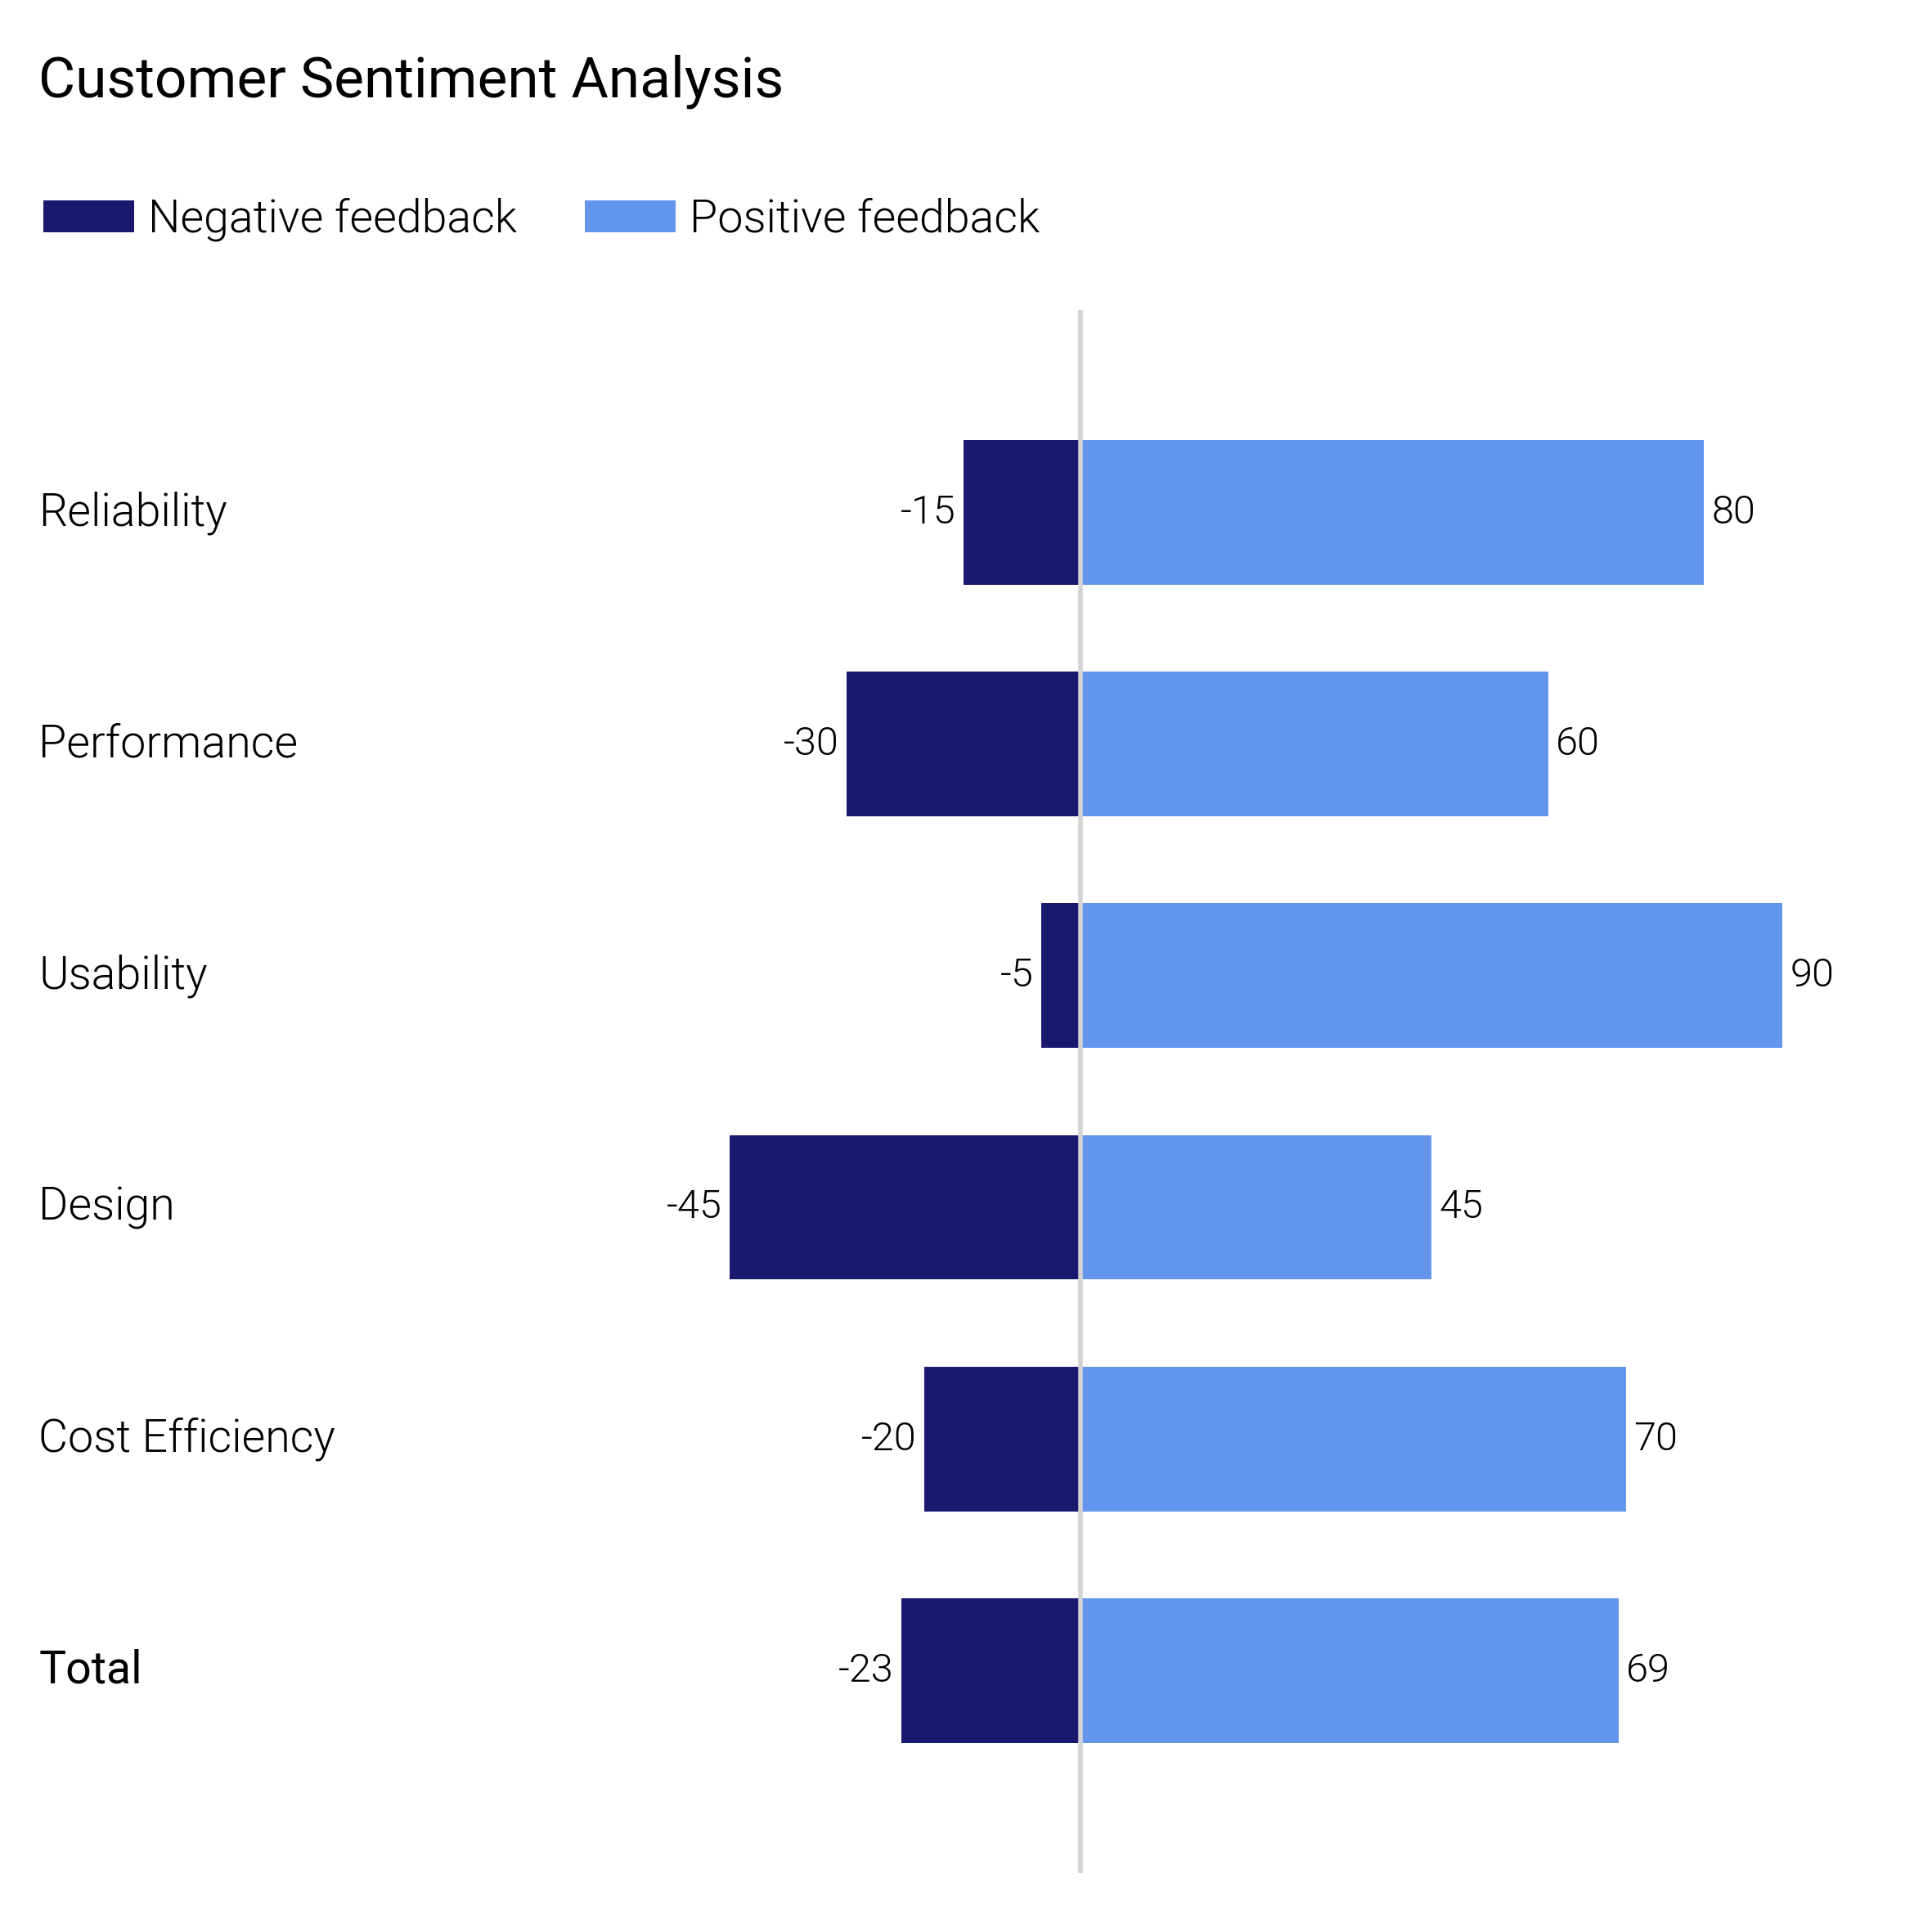
Diverging Bar Charts (templates)
Diverging bar charts are notoriously tricky to align in standard matplotlib.
The templates module provides plot_diverging_bar — a pre-configured,
highly styled template that handles text placement, axis centering, and
cascading legend layout automatically.
import numpy as np

import dartwork_mpl as dm
from dartwork_mpl.templates import plot_diverging_bar

dm.style.use("report")

labels = [
    "Reliability",
    "Performance",
    "Usability",
    "Design",
    "Cost Efficiency",
]
negatives = np.array([-15, -30, -5, -45, -20])
positives = np.array([80, 60, 90, 45, 70])

fig, ax = plot_diverging_bar(
    labels=labels,
    neg_values=negatives,
    pos_values=positives,
    title="Customer Sentiment Analysis",
    neg_label="Negative feedback",
    pos_label="Positive feedback",
)
Total running time of the script: (0 minutes 0.949 seconds)